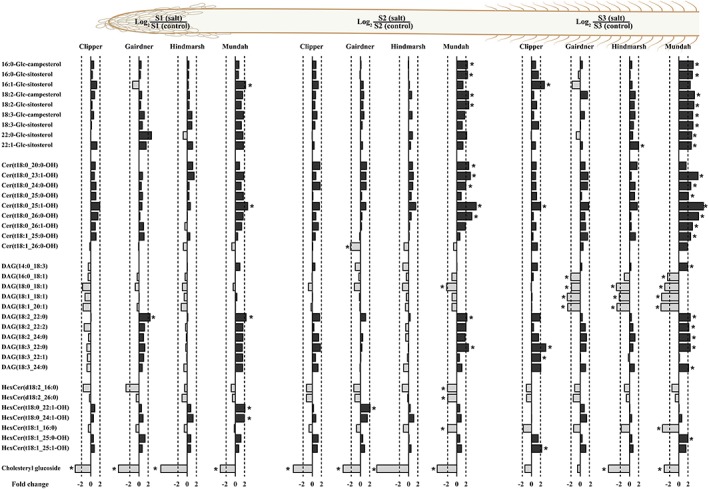
Figure 1.

Log2 ratios of representative sterol glucosides, diacylglycerols, ceramides, and hexosylceramides content in roots of barley cultivars Clipper, Gairdner, Hindmarsh, and Mundah that are salt grown (150 mM of NaCl) compared with control grown. Values that are significantly higher (P < .05, false discovery rate) are indicated with one asterisk. A threshold of ±2‐fold change is indicated by a dashed line. Image displays lipid contents of three developmental root zones: S1: root cap and zone of cell division, S2: zone of cell elongation, and S3: zone of cell maturation [Colour figure can be viewed at http://wileyonlinelibrary.com]
