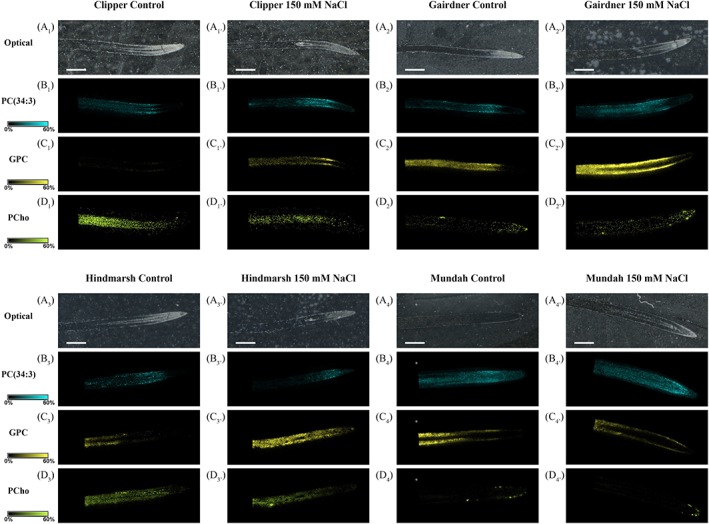
Figure 5.

Matrix‐assisted laser desorption/ionization mass spectrometry images of choline derivative compounds found distributed in longitudinal root sections of four barley cultivars grown under control and salt conditions. Ion image are displayed using the same intensity scale for each individual lipid species (solid colour: 0–60%). The mass accuracy was set at <0.005 ppm. Scale bars: 1,000 μm. Control and salt‐treated images were obtained in positive ionization mode with a scanning step size of 30 μm × 30 μm. Mass spectrometry images of the Hindmarsh cultivar have been reproduced from (Sarabia et al., 2018a). Letters: A, optical images; B, PC(34:3); C, GPC; D, PCho. Numbers: 1, Clipper; 2, Gairdner; 3, Hindmarsh; 4, Mundah. GPC: glycerophosphocholine; PCho: phosphocholine [Colour figure can be viewed at http://wileyonlinelibrary.com]
