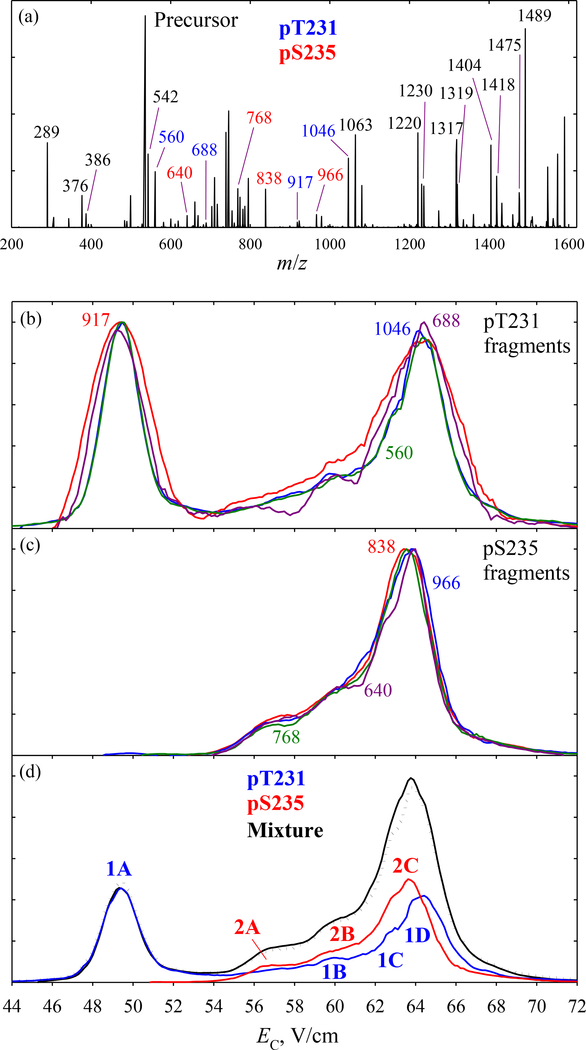
Fig. 1.
FAIMS/ETD data (with N2 buffer) for the pT231/pS235 mixture: (a) total ETD spectrum with c/z fragments labeled (unique fragments color-coded); (b, c) normalized spectra for all UF of pT231 and pS235 with the m/z values as marked; (d) measured trace (line) with the scaled spectra for both species produced by summing the spectra for all UF of each (above), and the mixture spectrum reconstructed by adding the two (dotted line).

