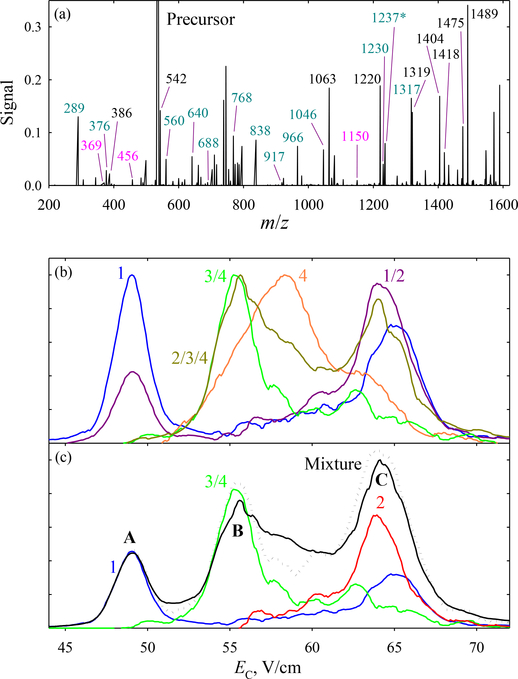
Fig. 3.
FAIMS/ETD data (with N2 buffer) for the four-variant mixture: (a) total ETD spectrum with c/z fragments labeled; (b) normalized spectra for the precursors or their groups derived by summing the spectra for all distinguishing fragments; (c) measured trace (line) with the scaled spectra for individual species derived from above data, and the mixture spectrum obtained by adding them all (dotted line).

