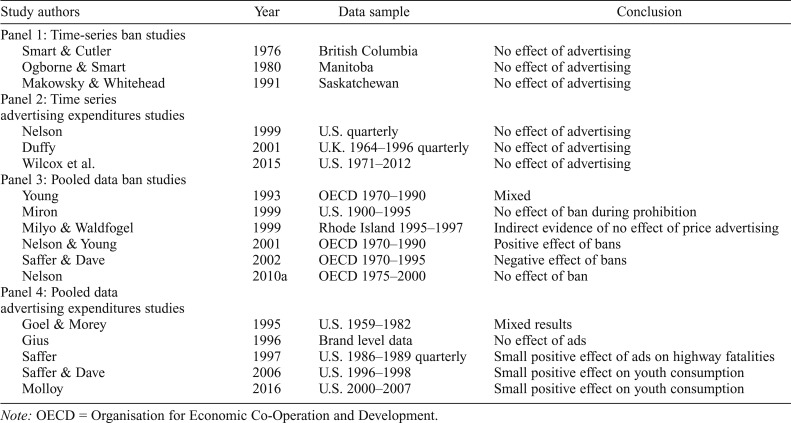
Table 1.
Econometric studies of alcohol advertising
| Study authors | Year | Data sample | Conclusion |
| Panel 1: Time-series ban studies | |||
| Smart & Cutler | 1976 | British Columbia | No effect of advertising |
| Ogborne & Smart | 1980 | Manitoba | No effect of advertising |
| Makowsky & Whitehead | 1991 | Saskatchewan | No effect of advertising |
| Panel 2: Time series advertising expenditures studies | |||
| Nelson | 1999 | U.S. quarterly | No effect of advertising |
| Duffy | 2001 | U.K. 1964–1996 quarterly | No effect of advertising |
| Wilcox et al. | 2015 | U.S. 1971–2012 | No effect of advertising |
| Panel 3: Pooled data ban studies | |||
| Young | 1993 | OECD 1970–1990 | Mixed |
| Miron | 1999 | U.S. 1900–1995 | No effect of ban during prohibition |
| Milyo & Waldfogel | 1999 | Rhode Island 1995–1997 | Indirect evidence of no effect of price advertising |
| Nelson & Young | 2001 | OECD 1970–1990 | Positive effect of bans |
| Saffer & Dave | 2002 | OECD 1970–1995 | Negative effect of bans |
| Nelson | 2010a | OECD 1975–2000 | No effect of ban |
| Panel 4: Pooled data advertising expenditures studies | |||
| Goel & Morey | 1995 | U.S. 1959–1982 | Mixed results |
| Gius | 1996 | Brand level data | No effect of ads |
| Saffer | 1997 | U.S. 1986–1989 quarterly | Small positive effect of ads on highway fatalities |
| Saffer & Dave | 2006 | U.S. 1996–1998 | Small positive effect on youth consumption |
| Molloy | 2016 | U.S. 2000–2007 | Small positive effect on youth consumption |
Note: OECD = Organisation for Economic Co-Operation and Development.

