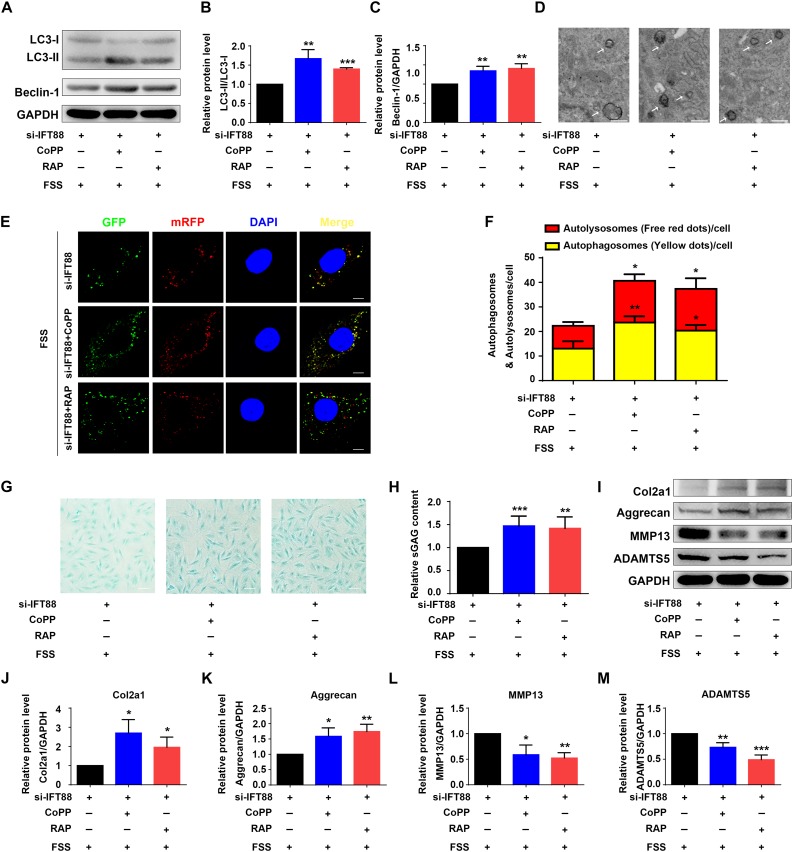
FIGURE 7.
HO-1 upregulation or rapamycin reverses IFT88 loss-induced alterations in autophagy and ECM production in FSS-treated NP cells. (A–C) Western blotting. NP cells were transfected with IFT88-siRNA. Then, cells were pretreated with CoPP (10 μM) or rapamycin (RAP, 500 nM) and subjected to 12 dyne/cm2 FSS for 2 h, followed by western blotting for expression of LC3-I, LC3-II, and Beclin-1 (A). Quantification of LC3-I/LC3-II ratio and Beclin-1 from three independent experiments (B,C). (D) Transmission Electron Microscopy (TEM). NP cells were treated as in panel (A). TEM images are shown. The arrows indicate double-membrane autophagosomes and autolysosomes. Bar, 500 nm. (E,F) Measurements of autophagosomes and autolysosomes. NP cells were transduced with lentivirus expressing a tandem mRFP-GFP-LC3 construct and treated as in panel (A). Fluorescence images were obtained. Bar, 5 μm. Quantification of autophagosomes (yellow dots) and autolysosomes (free red dots) from three independent experiments (F). (G,H) sGAG content. NP cells were treated as in panel (A), followed by alcian blue staining (G) and Blyscan Sulfated Glycosaminoglycan Assay (H). Bar, 100 μm. (I–M) Western blotting. NP cells were treated as in panel (A), followed by western blotting for expression of the indicated proteins (I). Quantification of expression of Col2a1, aggrecan, MMP13 and ADAMTS5 from three independent experiments (J–M). Results are expressed as mean ± standard deviation (s.d). *P < 0.05, **P < 0.01, and ***P < 0.001 vs. FSS + IFT88-siRNA group.

