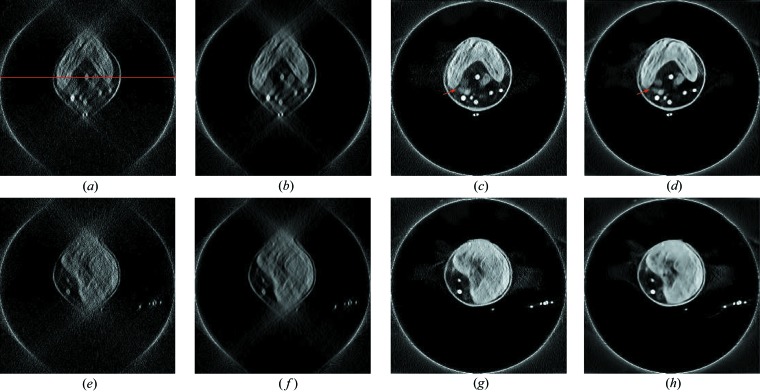
Figure 6.
The reconstruction results of two horizontal slices for the chlorella data, window: [0.003, 0.015] µm−1. The top row is for the 213th slice while the bottom row is for the 331st slice. The red line in (a) indicates the position of intensity profiles in Fig. 7 ▸. (a) f FBP, (b) f FBP, PWLS, (c) f U-Net, (d) f U-Net, PWLS, (e) f FBP, (f) f FBP, PWLS, (g) f U-Net and (h) f U-Net, PWLS.

