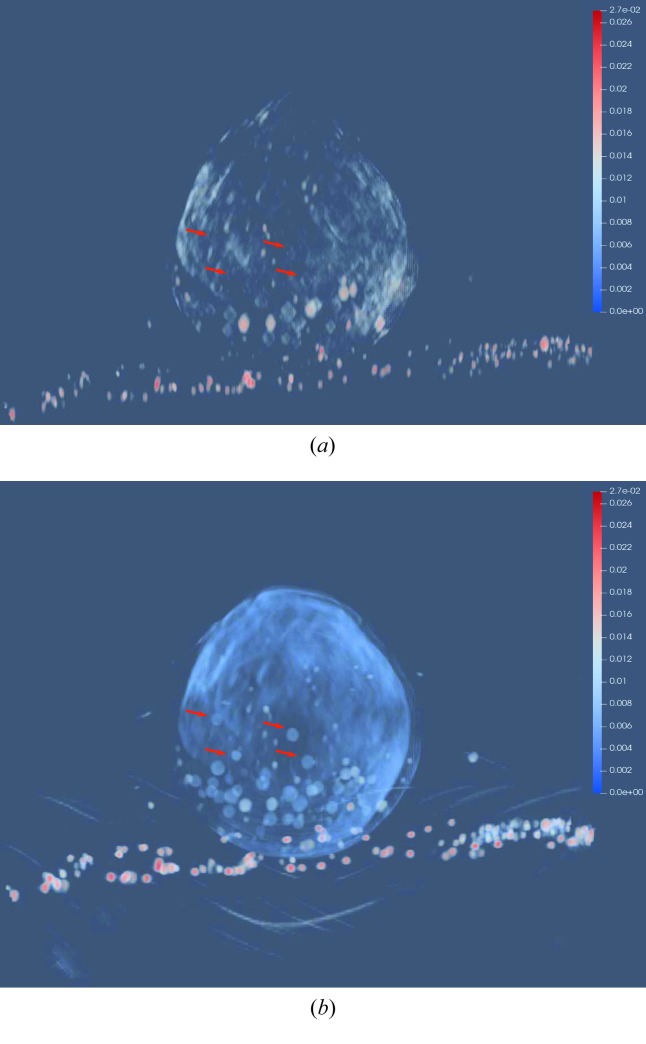
Figure 9.
The 3D rendering of the volumes reconstructed by FBP and U-Net with PWLS using the tool of ParaView, which is viewed along the z direction. The lipids indicated by the arrows are observed well in f U-Net, PWLS while they are barely seen in f FBP, PWLS. (a) f FBP, PWLS and (b) f U-Net, PWLS.

