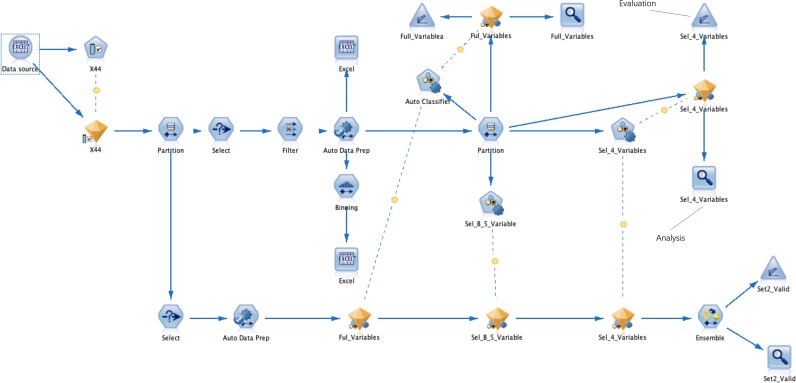
Figure 1.
The data flowed into the ‘Partition’ node after feature selection. The ‘Auto Data Prep’ node was used for data filling, the ‘Balance’ node performed a data balanced sampling process, and the ‘Binning’ node was applied for data binning. The ‘Partition’ node divided set 1 into a training set and a testing set, used the ‘Auto Classifier’ node to build various classification models, and used the ‘Analysis’ and ‘Evaluation’ nodes to output the AUC values and curve figure of each model. Use the ‘Select’ node to select the ‘Set 2’ data set. The set 2 set was concatenated with the models established above and the ensemble model of them, and the AUC values and graphs of all models were output using the ‘Analysis’ and ‘Evaluation’ nodes. AUC, area under the receiver operating characteristic curve.

