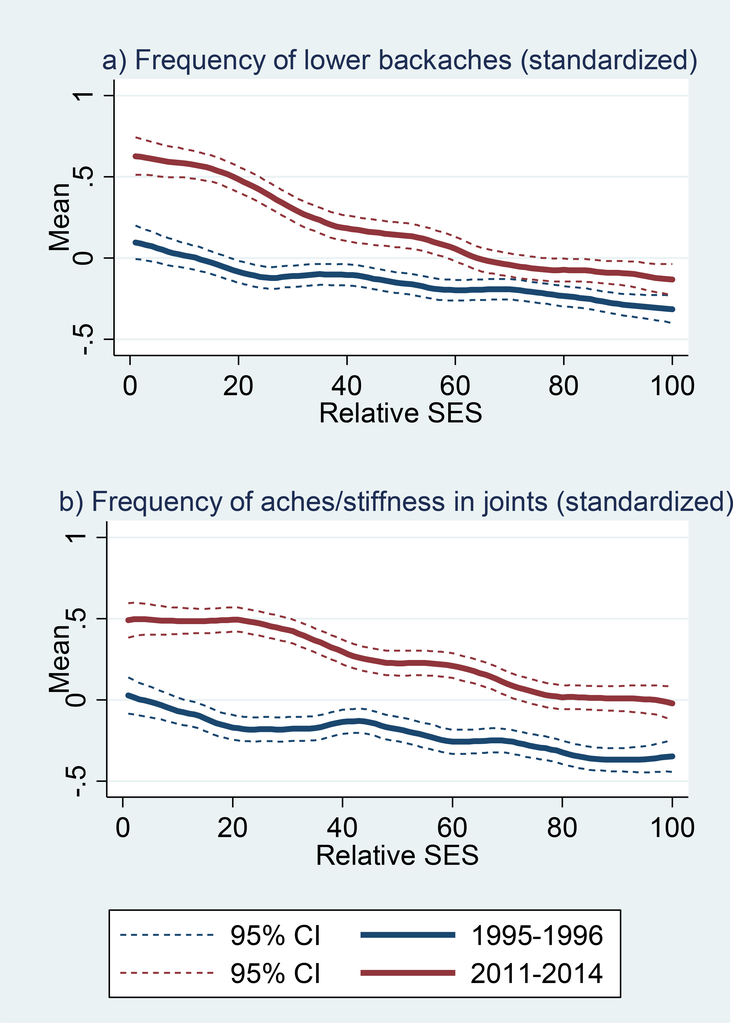
Figure 3. Smoothed bivariate plots of pain measures by relative SES at 1995–96 and 2011–14 MIDUS waves: a) backache and b) joint ache.
Note: SES is based on education, occupation, income, and assets; values represent the respondents’ percentile rank within the distribution at the specified survey wave.

