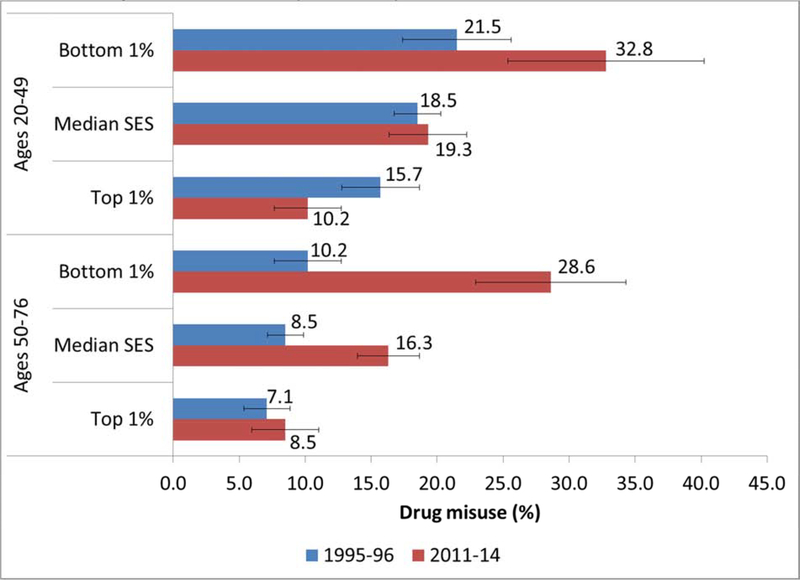
Figure 4. Estimated prevalence of drug misuse by survey wave, age group, and SES (bottom, median, and top percentile).
Note: SES is based on education, occupation, income, and assets and converted to a percentile rank denoting an individual’s position respondents’ percentile rank within the distribution at the specified survey wave. Predicted scores are computed using the coefficients from Model 1 (Table S1) for the two subpopulations (ages 20–49 and 50–76) and setting relative SES at the specified values (i.e., bottom and top percentile), while all other covariates (sex, race/ethnicity, and marital status) remain at the observed values among the pooled sample. Similar estimates could be shown for any level of SES. Error bars indicate the 95% confidence interval for each estimate.

