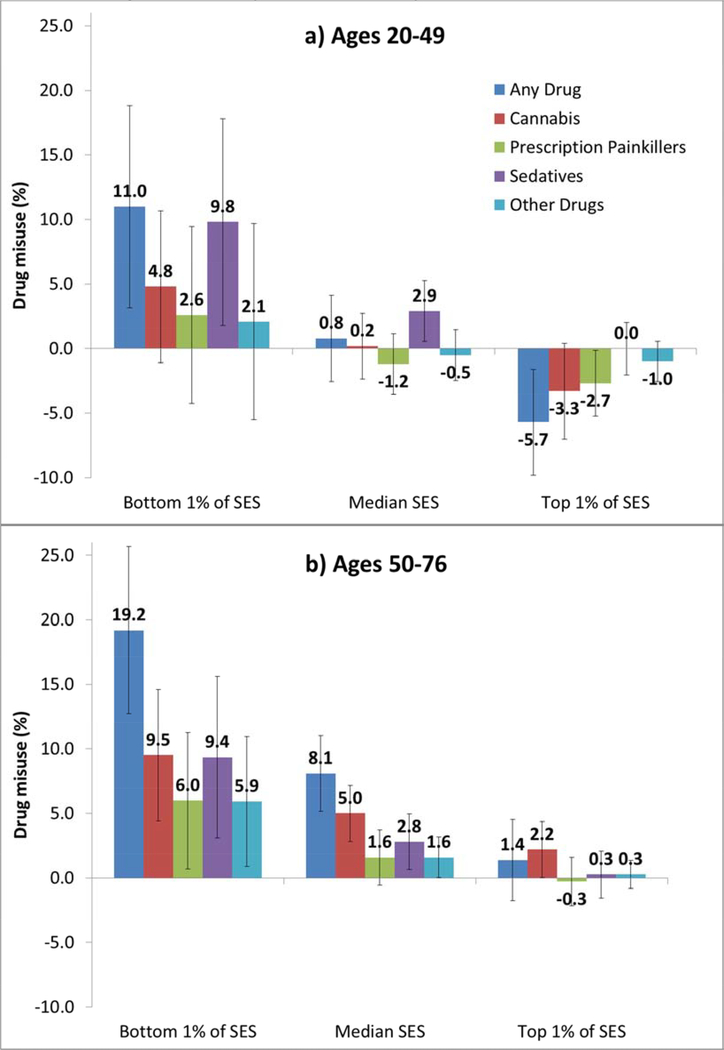
Figure 5. Period differential (2011–14 minus 1995–96) in estimated prevalence of drug misuse by type of drug, age group, and SES (bottom, median, and top percentile).
Note: SES is based on education, occupation, income, and assets and converted to a percentile rank denoting an individual’s position respondents’ percentile rank within the distribution at the specified survey wave. Values represent the average marginal effect of period based on Model 1 (Tables 2, S1, and S2) for the two subpopulations (ages 20–49 and 50–76) and setting relative SES at the specified values (i.e., bottom and top percentile), while all other covariates (sex, race/ethnicity, and marital status) remain at the observed values among the pooled sample. These period differentials represent the full range of SES, but one could show the corresponding period effect for any level of SES. Error bars indicate the 95% confidence interval for each estimate.

