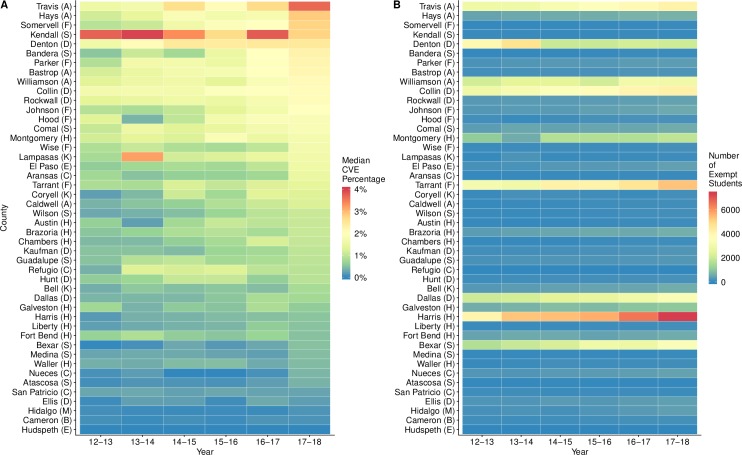
Fig 1. CVE trends in counties within ten major metropolitan areas of Texas.
A: The median CVE percentages across all public, private, and charter school systems in each county and year. B: The estimated number of vaccination-exempt students in each county and year. For each county, we summed the product of each school system's annual CVE percentage and its 2016 enrollment. In both graphs, counties are ordered according to their 2017–2018 median CVE percentage. The metropolitan areas are indicated by the following: Houston (H), Dallas (D), Fort Worth (F), San Antonio (S), Austin (A), McAllen (M), El Paso (E), Corpus Christi (C), Brownsville (B), and Killeen (K). The values for 2017–2018 are also depicted on a map of Texas counties (Fig B in S1 Appendix). CVE, conscientious vaccination exemption.

