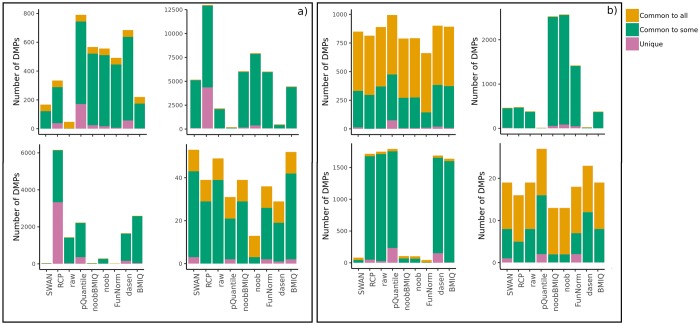
Fig 5. Bar plots of the number of DMPs found by each pre-processing method, considering both datasets pre-processed in the same way.
Colours indicate: (i) the number of DMPs that are found by at least one other method (Common to some), (ii) by all the methods (Common to all) or (iii) only by that method (Unique). Results are shown for the four analyses: BloodIBD (top-left), BloodParkinson (top-right), NasalAsthma (bottom-left), BuccalFetalAlcohol (bottom-right). Panel a) refers to the case where regRCPqn is not applied, while panel b) shows the results obtained using regRCPqn.

