Figure 1.

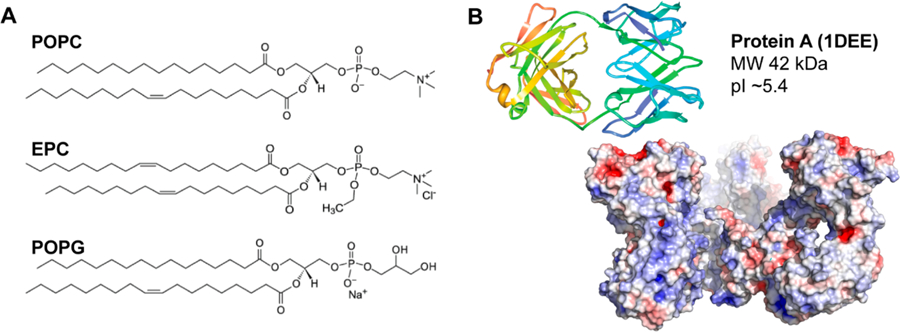
(A) Structures of the lipids investigated based on varied charges. (B) Crystal structure and electrostatic potential map of protein A. Blue is indicative of negatively charged areas, while red is indicative of positively charged areas.

(A) Structures of the lipids investigated based on varied charges. (B) Crystal structure and electrostatic potential map of protein A. Blue is indicative of negatively charged areas, while red is indicative of positively charged areas.