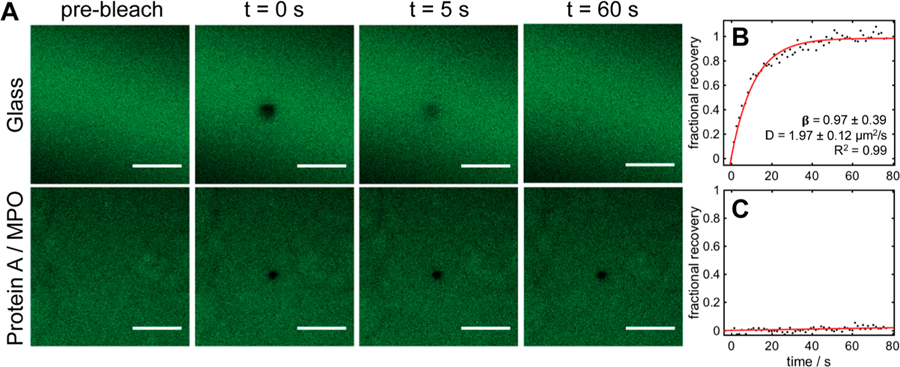
Figure 4.

Images depicting FRAP analysis of EPC+ lipids formed over a glass coverslip and a protein A/MPO coated coverslip. (A) Fluorescence micrographs of photobleaching and recovery. Scale bars represent 30 μm. (B, C) Corresponding recovery data for EPC+ over glass (B) and protein A/MPO surface (C). Error bars represent standard deviations from three replicate experiments.
