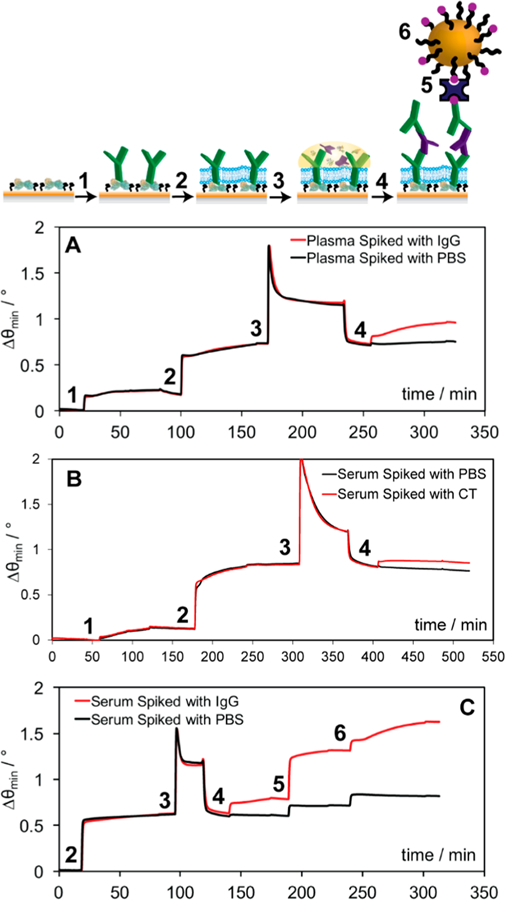
Figure 5.

Schematic and (A) sensorgram representing the detection of mouse IgG (red) in undiluted human plasma where the capture antibody is injected (1), followed by the EPC lipid vesicles (2), the plasma spiked with mouse IgG (3), and finally a detection antibody for enhancement (4). (B) Sensorgram representing the detection of CT (red) in undiluted human serum using a surface chemistry similar to that of the IgG, and the addition of serum spiked with CT (3), and finally a detection anti-CT for enhancement (4). (C) Sensorgram representing the detection of mouse IgG (red) in undiluted human serum where the capture antibody injected was applied offline and the EPC lipid vesicles were injected online (2), followed by the serum spiked with mouse IgG (3), a biotinylated detection antibody (4), streptavidin bridge (5), and biotin-labeled gold nanoparticles (6) for enhancement.
