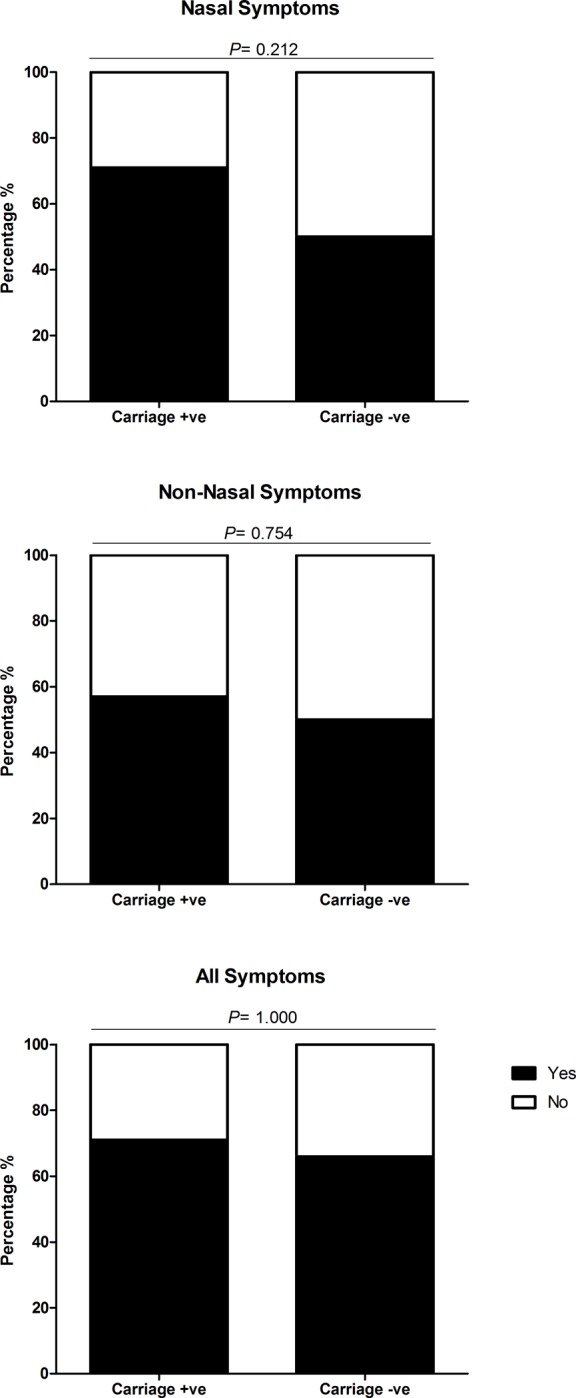
Fig 3. Comparison of nasal, non-nasal and all symptoms between experimental SPN positive and negative participants.

Each bar chart shows the percentage of carriage positive (N = 14) and carriage negative (N = 32) participants, who reported symptoms (nasal, non-nasal and all symptoms) after inoculation with Streptococcus pneumoniae serotypes 6B or 23F. Participants were deemed symptomatic if they scored >2, or >1 point above baseline for any of the five nasal or non-nasal symptoms in the visual analogue scale. The number of participants reporting symptoms between carriage positive and negative status were statistically compared using Fishers Exact and deemed significant if P = ≤0.05. There was no significant difference in the number of participants reporting nasal (OR 2.50 [95% CI: 0.65–9.66] P = 0.212), non-nasal (OR 1.33 [95% CI: 0.38–4.73] P = 0.754) or all symptoms (OR 1.31 [95% CI: 0.33 to 5.16] P = 1.000) between carriage positive and carriage negative participants.
