
Fig 4. Comparison of nasal, non-nasal and all symptoms between participants inoculated with S. pneumoniae compared to those inoculated with normal saline (control).
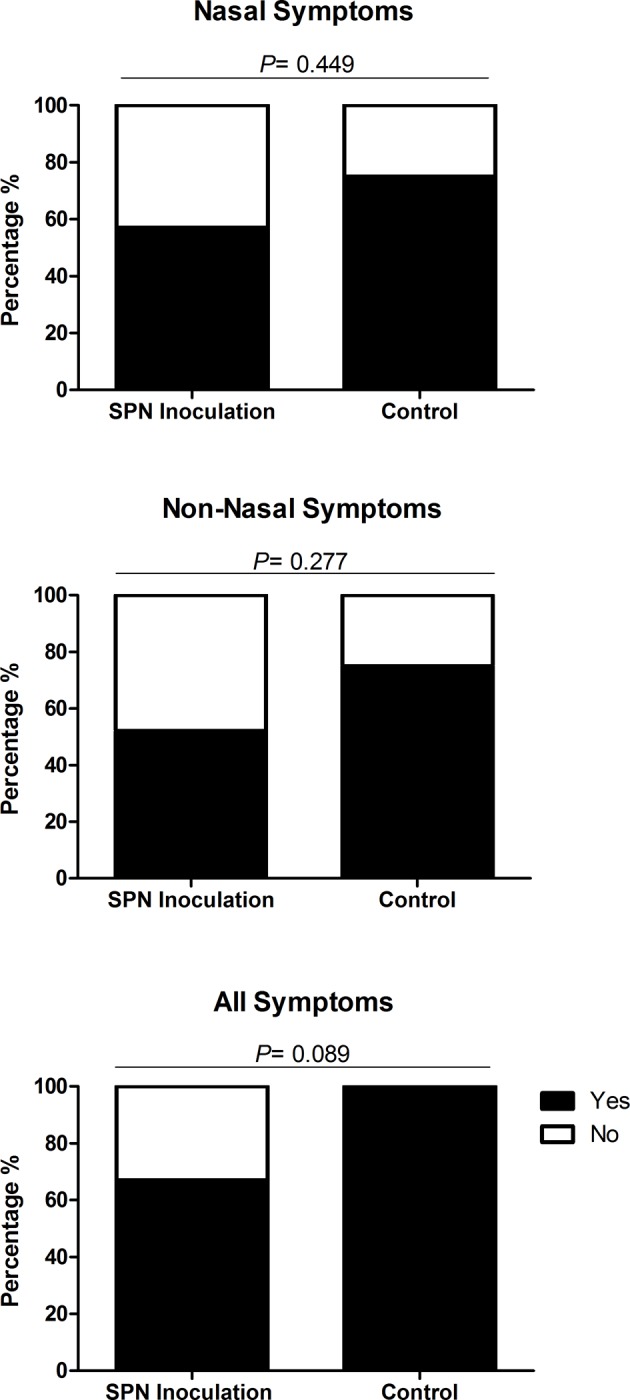
Each bar chart shows the percentage of participants inoculated with S. pneumoniae (SPN) serotypes 6B and 23F (N = 46) and normal saline (control) (N = 8) reporting symptoms (nasal, non- nasal and all symptoms) after inoculation. Participants were deemed symptomatic if they scored >2, or >1 point above baseline for any of the five nasal or non-nasal symptoms on the visual analogue scale. The number of participants reporting symptoms between inoculation with SPN and control were statistically compared using Fishers Exact and deemed significant if P = ≤0.05. There was no significant difference in the number of participants reporting nasal (OR 0.43 [95% CI: 0.08–2.38] P = 0.449), non-nasal (OR 0.36 [95% CI: 0.07–2.00] P = 0.277) and all symptoms (OR 0.12 [95% CI: 0.01–2.21] P = 0.089).