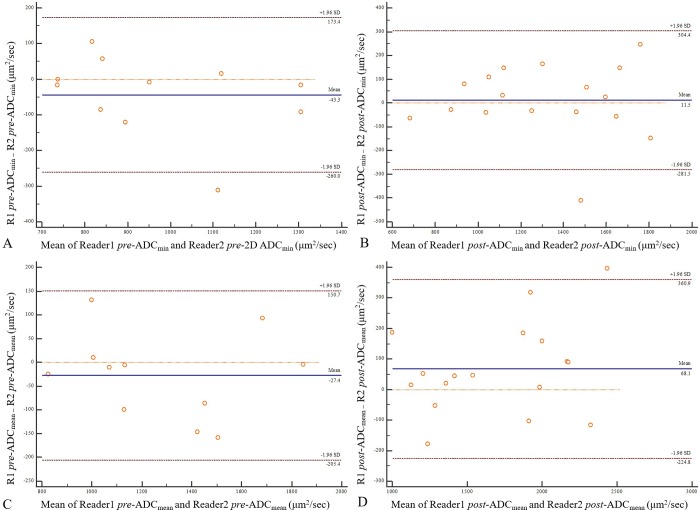
Fig 2. Bland-Altman plots of ADC measurements derived from single-section ROIs between two readers.
(A) pretreatment 2D ADCminimum, (B) posttreatment 2D ADCminimum, (C) pretreatment 2D ADCmean, and (D) posttreatment 2D ADCmean. The unit of ADC is μm2/sec. pre- = pretreatment; post- = posttreatment; ADCmin = ADCminimum.

