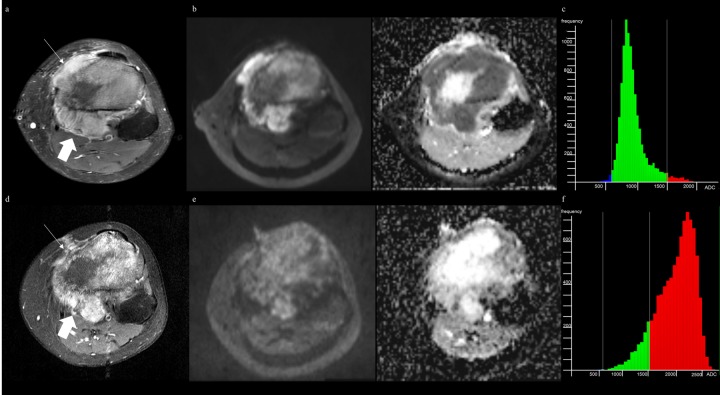
Fig 3. MRI of fibroblastic osteosarcoma and applying ADC values derived from single-section ROI can complement diagnostic ability.
(A) Axial fat-suppressed (FS) contrast-enhanced T1-weighted image (T1WI) before treatment shows a tumor in proximal tibia with extraosseous lesions (arrows). (B) DWI (b of 800 sec/mm2) with ADC map before treatment shows 2D ADCminimum and 2D ADCmean of 870μm2/sec and 1011μm2/sec, respectively. (C) ADC histogram derived from whole-tumor volume before treatment shows 3D ADCmean of 943μm2/sec, 3D ADCskewness of 1.54, and 3D ADCkurtosis of 6.83. (D) Axial FS contrast-enhanced T1WI after treatment shows the little change in size with heterogeneously enhancing extraosseous lesion (thick arrow), interpreted as equivocal in both readers. (E) DWI with ADC map after treatment shows 2D ADCminimum and 2D ADCmean of 1542μm2/sec and 2107μm2/sec, respectively, indicating a good responder. (F) ADC histogram derived from whole-tumor volume after treatment shows 3D ADCmean of 1994μm2/sec, 3D ADCskewness of -0.82, and 3D ADCkurtosis of 3.43. The percent change of 2D ADCminimum and 2D ADCmean present as 77.2% and 105.6%, respectively. At histopathology, the tumor showed more than 95% necrosis, demonstrating a good responder.

