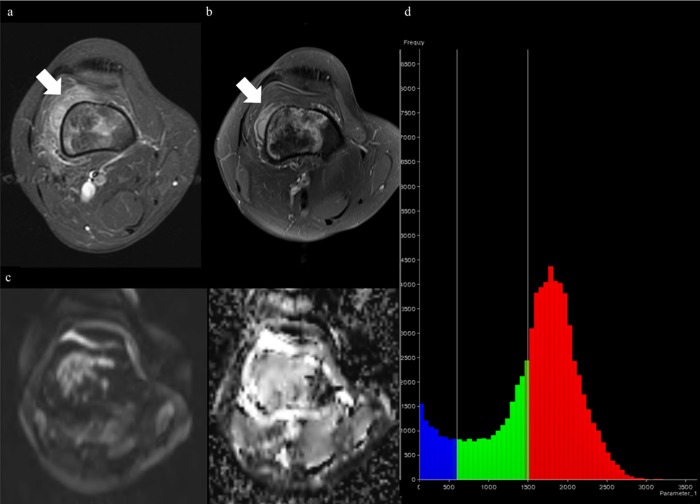
Fig 5. MRI of osteoblastic and chondroblastic osteosarcoma, lack of pretreatment DWI, indicating that ADC values derived from whole-tumor volume can reinforce diagnostic ability.
(A) Axial fat-suppressed (FS) contrast-enhanced T1-weighted image (T1WI) before treatment shows a tumor with extraosseous lesion (thick arrow) in distal femur. (B) Axial FS contrast-enhanced T1WI after treatment shows slight decrease in extraosseous tumor size (thick arrow), interpreted as equivocal in reader 1. (C) DWI (b of 800 sec/mm2) with ADC map after treatment shows 2D ADCminimum and 2D ADCmean of 1235μm2/sec and 1968μm2/sec, respectively. Posttreatment values are also equivocal because of neighboring cutoff values and lack of pretreatment DWI. (D) ADC histogram derived from whole-tumor volume after treatment shows 3D ADCmean of 1864μm2/sec, 3D ADCskewness of 0.185, and 3D ADCkurtosis of 4.14, suggesting a poor responder. The histopathologic finding demonstrates a poor treatment response (necrosis = 70%).

