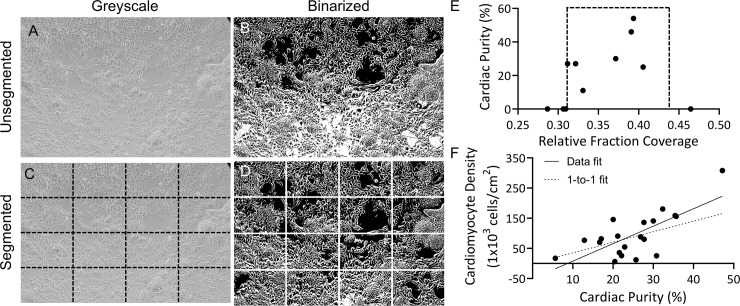
Fig 3. Segmented thresholding shows range of plate coverage for cardiomyocyte differentiation using 6 μM Chiron.
(A) Brightfield image of Gibco hiPSCs (GiPSCs) at day 0 of differentiation. (B) Threshold of image without prior segmentation. (C) Segmented image, indicated by dashed black lines, and (D) reconstructed image after thresholding of segments. (E) GiPSC-cardiomyocyte purity plotted as a function of relative fraction coverage at day 0, dashed box indicated range of plate coverage in which differentiation runs produced cardiomyocytes. N = 11 independent differentiation runs; data points represent single differentiation run outcomes. (F) HiPSC-cardiomyocyte density per cm2 of growth area as a function of cardiac purity was fit with a linear regression. Data points represent single differentiation run outcomes (n = 20); solid line: linear regression, R2 = 0.51; dashed line: linear regression assuming 1-to-1 relationship between cardiomyocyte purity and density.

