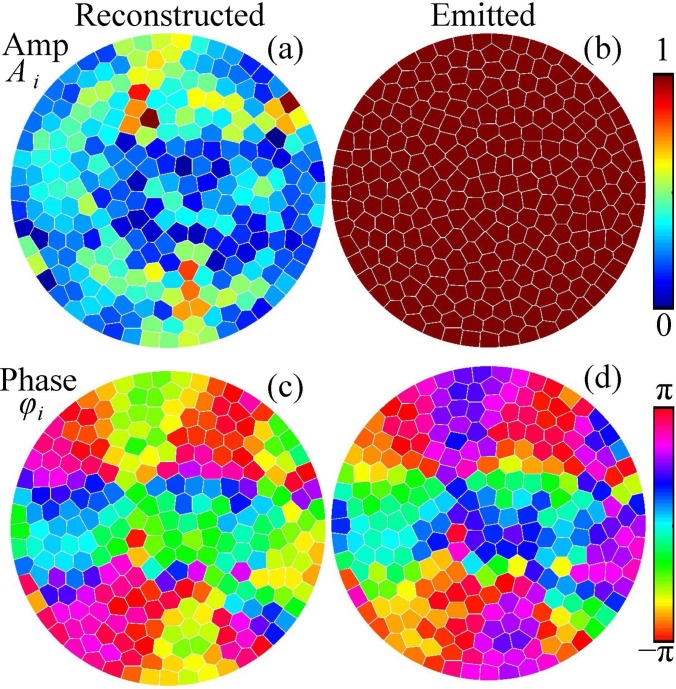
FIG. 8.
(Color online) Distributions of the (a) vibrational velocity amplitudes Ai and (c) phases φi at the elements of the array that provide the best reconstruction of the complex pressure amplitude at the boundary of compensation. The boundary condition to the modeling is set by choosing the uniform amplitude (b) and inverted phase (d) distributions at the array elements.

