. 2020 Feb 27;128(2):027008. doi: 10.1289/EHP5862

Figure 5.

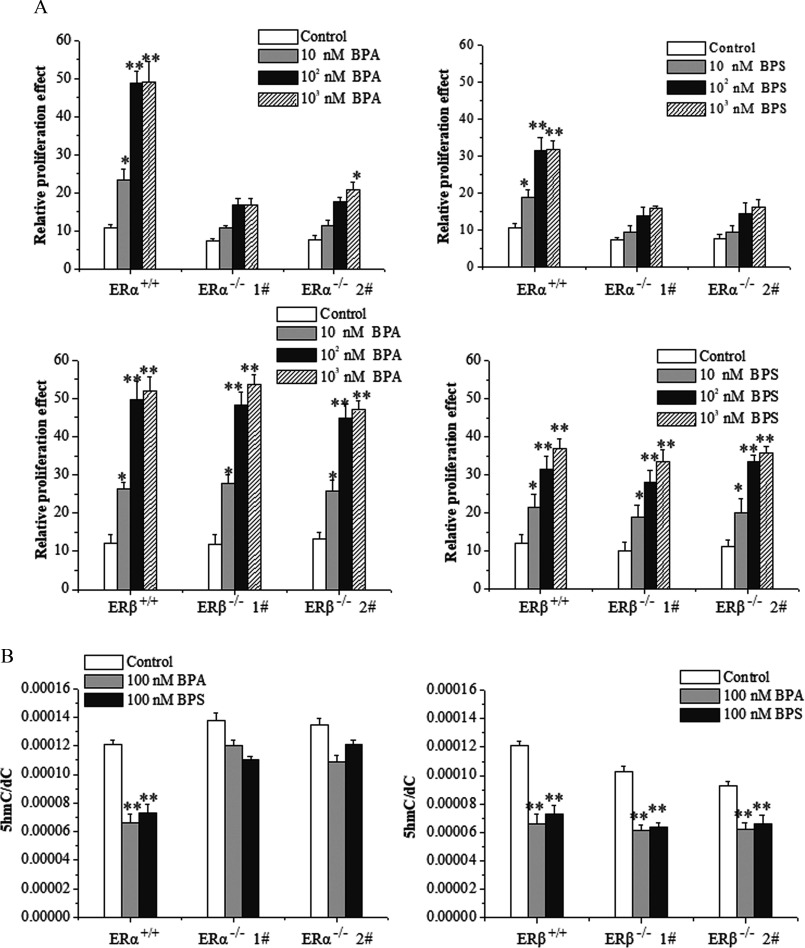
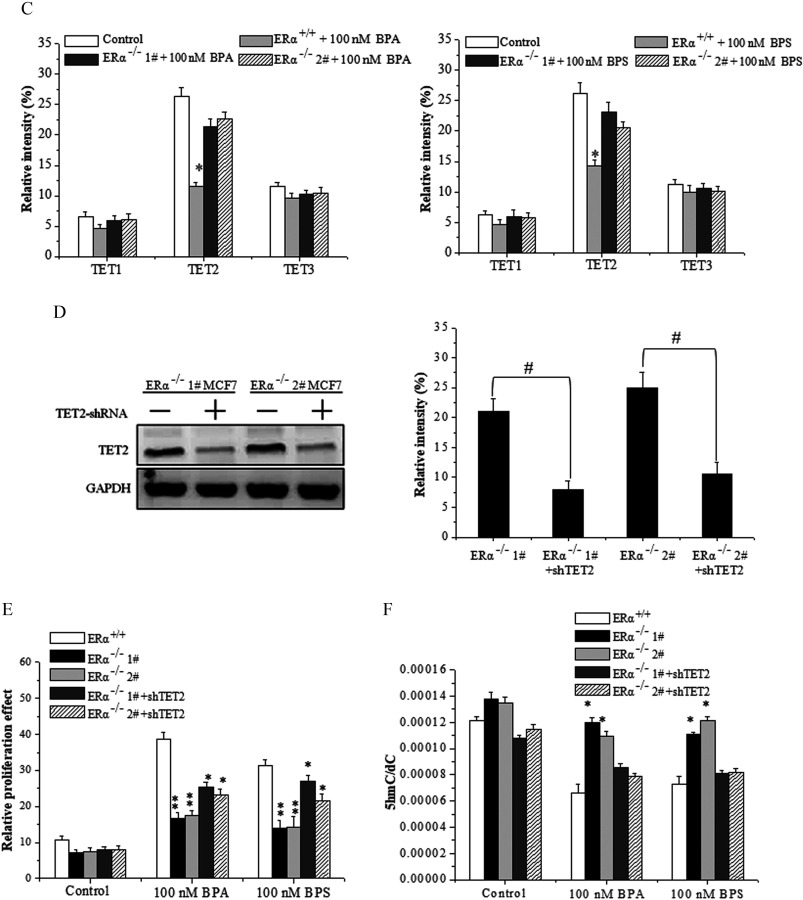
Figure 5A comprises four bar graphs. The first and third bar graphs plot relative proliferation effect, ranging from 0 to 60 in increments of 10 (y-axis) for control, 10 nanomolar BPA, 10 superscript 2 nanomolar BPA, and 10 superscript 3 nanomolar BPA across ER alpha superscript positive virgule positive, ER alpha superscript negative virgule negative 1 hash, ER alpha beta superscript negative virgule negative 2 hash and ER beta superscript positive virgule positive, ER beta superscript negative virgule negative 1 hash, and ER beta superscript negative virgule negative 2 hash, respectively, (x-axis). The second and the fourth graphs plot relative proliferation effect, ranging from 0 to 60 in increments of 10 (y-axis) for control, 10 nanomolar BPS, 10 superscript 2 nanomolar BPS, and 10 superscript 3 nanomolar BPS across ER alpha superscript positive virgule positive, ER alpha superscript negative virgule negative 1 hash, ER alpha beta superscript negative virgule negative 2 hash and ER beta superscript positive virgule positive, ER beta superscript negative virgule negative 1 hash, and ER beta superscript negative virgule negative 2 hash, respectively, (x-axis). Figure 5B comprises two bar graphs. The first and second bar graphs plot 5hmC virgule dC, ranging from 0.00000 to 0.00016 in increments of 0.00002 (y-axis) for control, 100 nanomolar BPA, and 100 nanomolar BPS across ER alpha superscript positive virgule positive, ER alpha superscript negative virgule negative 1 hash, ER alpha beta superscript negative virgule negative 2 hash and ER beta superscript positive virgule positive, ER beta superscript negative virgule negative 1 hash, and ER beta superscript negative virgule negative 2 hash, respectively, (x-axis). Figure 5C comprises two bar graphs. The first and second bar graphs plot relative intensity, ranging from 0 to 35 percent in increments of 5 (y-axis) for control, ER alpha superscript positive virgule positive plus 100 nanomolar BPA, ER alpha superscript negative virgule negative 1 hash plus 100 nanomolar BPA, ER alpha superscript negative virgule negative 2 hash plus 100 nanomolar BPA and control, ER alpha superscript positive virgule positive plus 100 nanomolar BPS, ER alpha superscript negative virgule negative 1 hash plus 100 nanomolar BPS, ER alpha superscript negative virgule negative 2 hash plus 100 nanomolar BPS, respectively, over TET 1, TET2, and TET3 (x-axis). Figure 5D comprises a set of two Western blots and a bar graph. The Western blots display TET2-shRNA positive and negative in ER alpha superscript negative virgule negative 1 hash MCF7 and positive and negative in ER alpha superscript negative virgule negative 2 hash MCF7 across the top as columns and TET2 and GAPDH across the left as rows. The graph plots relative intensity, ranging from 0 to 35 percent in increments of 5 (y-axis) across ER alpha superscript negative virgule negative 1 hash, ER alpha superscript negative virgule negative 1 hash plus shTET2, ER alpha superscript negative virgule negative 2 hash, and ER alpha superscript negative virgule negative 2 hash plus shTET2 (x-axis). Figures 5E and 5F plot relative proliferation effect, ranging from 0 to 60 in increments of 10 and 5hmC virgule dC from 0.00000 to 0.00016 in increments of 0.00002, respectively, (y-axis) for ER alpha superscript positive virgule positive, ER alpha superscript negative virgule negative 1 hash, ER alpha superscript negative virgule negative 2 hash, ER alpha superscript negative virgule negative 1 hash plus shTET2, and ER alpha superscript negative virgule negative 2 hash plus shTET2 across control, 100 nanomolar BPA, and 100 nanomolar BPS (x-axis).

Figure 5A comprises four bar graphs. The first and third bar graphs plot relative proliferation effect, ranging from 0 to 60 in increments of 10 (y-axis) for control, 10 nanomolar BPA, 10 superscript 2 nanomolar BPA, and 10 superscript 3 nanomolar BPA across ER alpha superscript positive virgule positive, ER alpha superscript negative virgule negative 1 hash, ER alpha beta superscript negative virgule negative 2 hash and ER beta superscript positive virgule positive, ER beta superscript negative virgule negative 1 hash, and ER beta superscript negative virgule negative 2 hash, respectively, (x-axis). The second and the fourth graphs plot relative proliferation effect, ranging from 0 to 60 in increments of 10 (y-axis) for control, 10 nanomolar BPS, 10 superscript 2 nanomolar BPS, and 10 superscript 3 nanomolar BPS across ER alpha superscript positive virgule positive, ER alpha superscript negative virgule negative 1 hash, ER alpha beta superscript negative virgule negative 2 hash and ER beta superscript positive virgule positive, ER beta superscript negative virgule negative 1 hash, and ER beta superscript negative virgule negative 2 hash, respectively, (x-axis). Figure 5B comprises two bar graphs. The first and second bar graphs plot 5hmC virgule dC, ranging from 0.00000 to 0.00016 in increments of 0.00002 (y-axis) for control, 100 nanomolar BPA, and 100 nanomolar BPS across ER alpha superscript positive virgule positive, ER alpha superscript negative virgule negative 1 hash, ER alpha beta superscript negative virgule negative 2 hash and ER beta superscript positive virgule positive, ER beta superscript negative virgule negative 1 hash, and ER beta superscript negative virgule negative 2 hash, respectively, (x-axis). Figure 5C comprises two bar graphs. The first and second bar graphs plot relative intensity, ranging from 0 to 35 percent in increments of 5 (y-axis) for control, ER alpha superscript positive virgule positive plus 100 nanomolar BPA, ER alpha superscript negative virgule negative 1 hash plus 100 nanomolar BPA, ER alpha superscript negative virgule negative 2 hash plus 100 nanomolar BPA and control, ER alpha superscript positive virgule positive plus 100 nanomolar BPS, ER alpha superscript negative virgule negative 1 hash plus 100 nanomolar BPS, ER alpha superscript negative virgule negative 2 hash plus 100 nanomolar BPS, respectively, over TET 1, TET2, and TET3 (x-axis). Figure 5D comprises a set of two Western blots and a bar graph. The Western blots display TET2-shRNA positive and negative in ER alpha superscript negative virgule negative 1 hash MCF7 and positive and negative in ER alpha superscript negative virgule negative 2 hash MCF7 across the top as columns and TET2 and GAPDH across the left as rows. The graph plots relative intensity, ranging from 0 to 35 percent in increments of 5 (y-axis) across ER alpha superscript negative virgule negative 1 hash, ER alpha superscript negative virgule negative 1 hash plus shTET2, ER alpha superscript negative virgule negative 2 hash, and ER alpha superscript negative virgule negative 2 hash plus shTET2 (x-axis). Figures 5E and 5F plot relative proliferation effect, ranging from 0 to 60 in increments of 10 and 5hmC virgule dC from 0.00000 to 0.00016 in increments of 0.00002, respectively, (y-axis) for ER alpha superscript positive virgule positive, ER alpha superscript negative virgule negative 1 hash, ER alpha superscript negative virgule negative 2 hash, ER alpha superscript negative virgule negative 1 hash plus shTET2, and ER alpha superscript negative virgule negative 2 hash plus shTET2 across control, 100 nanomolar BPA, and 100 nanomolar BPS (x-axis).

Cell proliferation, 5-hydroxymethylcytosine (5hmC) level, and ten-eleven translocation 2 (TET2) expression in estrogen-receptor-knockout MCF-7 cells treated with bisphenol A (BPA) or bisphenol S (BPS). (A) Cell proliferation assay by MTS of ERα/ and ERβ/ MCF-7 cells exposed to vehicle, BPA, or BPS. Data represent mean±SD of five independent experiments. Statistical analysis was performed with two-way ANOVA (with Bonferroni posttest): *, p<0.05 or **, p<0.01 vs. control of ERα+/+ or ERβ+/+ cells. (B) 5hmC frequency measured by UHPLC-MRM MS/MS analysis of digested genomic DNA from ERα/ and ERβ/ MCF-7 cells exposed to vehicle, BPA, or BPS. Data represent mean±SD of five independent experiments. Statistical analysis was performed with two-way ANOVA (with Bonferroni posttest). *, p<0.05 or **, p<0.01 vs. control of ERα+/+ or ERβ+/+ cells. (C) Quantification of Western blot detection of TET1, TET2, and TET3 proteins in ERα/ MCF-7 cells at 48 h after vehicle, BPA, or BPS treatment. The relative intensity was analyzed with ImageJ software (Schneider et al. 2012) and calculated by the ratio relative to the GAPDH intensity. Data represent mean±SD of three independent experiments. Statistical analysis was performed with Student’s paired t-test. *, p<0.05 vs. control. (D) Identification of TET2 protein in ERα/ MCF-7 cells transfected with short hairpin RNA (shRNA)-TET2 plasmid using Western blot. The relative intensity was analyzed with ImageJ software and calculated by the ratio relative to the GAPDH intensity. Data represent mean±SD of three independent experiments. Statistical analysis was performed with Student’s paired t-test. #, p<0.05 vs. indicated samples. (E) Cell proliferation assay by MTS of ERα/ MCF-7 cells transfected with shRNA-TET2 exposed to BPA and BPS. Data represent mean±SD of five independent experiments. Statistical analysis was performed with two-way ANOVA (with Bonferroni posttest). *, p<0.05 or **, p<0.01 vs. ERα+/+ of each treatment. (F) 5hmC frequency measured by UHPLC-MRM MS/MS analysis of digested genomic DNA from ERα/ MCF-7 cells transfected with shRNA-TET2 exposed to BPA and BPS. Data represent mean±SD of five independent experiments. Statistical significance was evaluated by two-way ANOVA (with Bonferroni posttest). *, p<0.05 or **, p<0.01 vs. control of ERα+/+ cells. Note: ANOVA, analysis of variance; GAPDH, glyceraldehyde 3-phosphate dehydrogenase; MTS, a tetrazolium salt; SD, standard deviation; UHPLC-MRM MS/MS, ultra-high performance liquid chromatography–tandem mass spectrometry.