. 2020 Mar 10;9:e49962. doi: 10.7554/eLife.49962

Figure 3. Distributions of polygenic scores between ‘high achievers’ and all other pupils.

(A) Polygenic score distributions for the GWAS significant polygenic score. (B) Polygenic score distributions for the all SNP polygenic score. High achievers defined as pupils with age 16 educational exam scores in the top 10% of the sample. Polygenic scores (PGS) built using only genome-wide significant SNPs (GWAS sig PGS) or all education associated SNPs (all SNP PGS) from the largest GWAS of educational attainment (Lee et al., 2018).

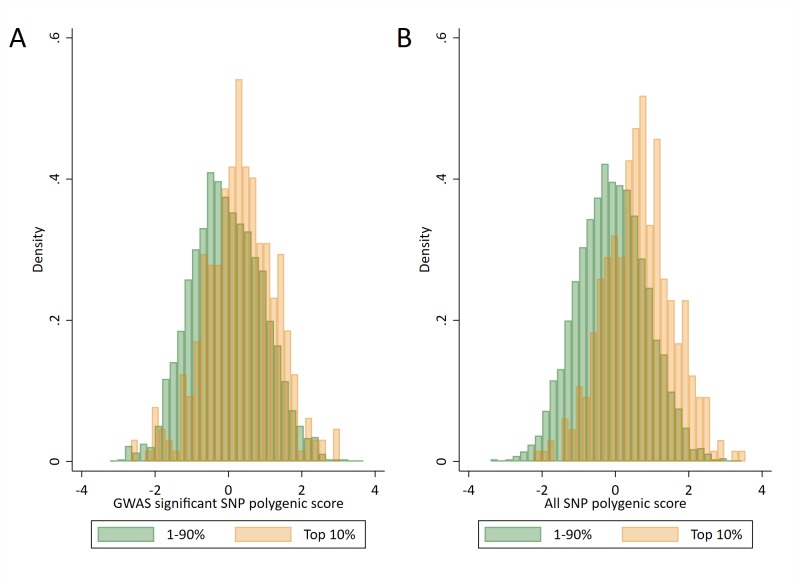
Figure 3.

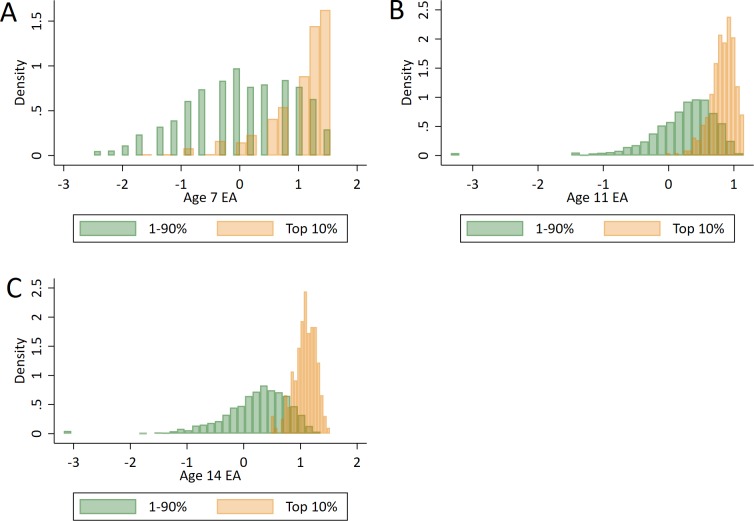
Figure 3—figure supplement 1. Distributions of prior achievement between ‘high achievers’ at age 16 and all other pupils.

Figure 3—figure supplement 1.

(A) Prior achievement at age 7. (B) Prior achievement at age 11. (C) Prior achievement at age 14. Educational achievement (EA) measured using fine graded point scores from educational exams taken at ages 7, 11 and 14. s High achievers defined as pupils with age 16 educational exam scores in the top 10% of the sample. Prior attainment measured as educational achievement (EA) at ages.