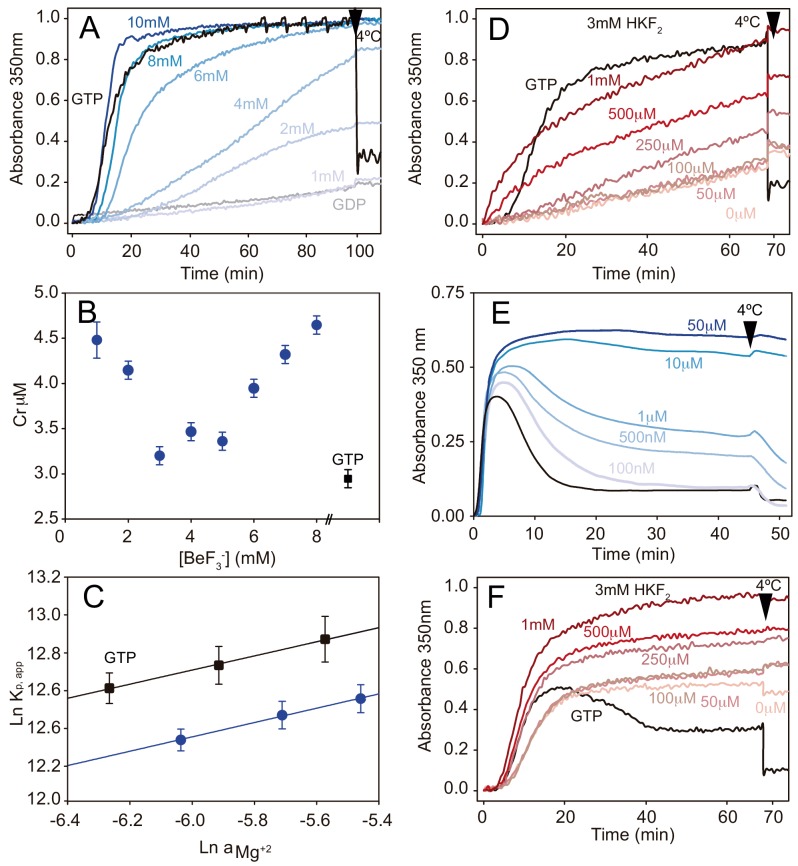
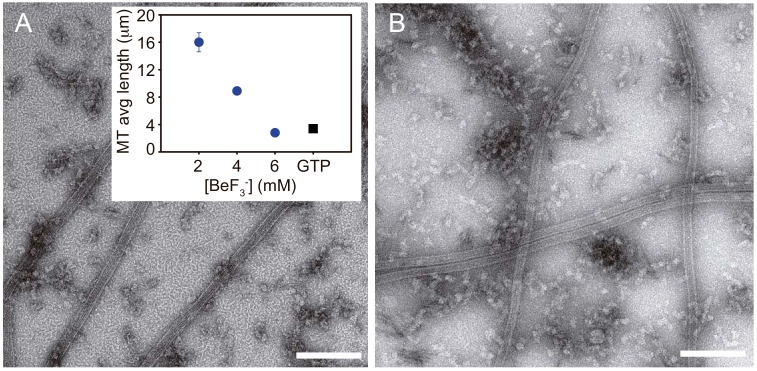
Figure 2. Phosphate analogues sustain tubulin activation and MT stabilization.
(A) Time course assembly of 30 μM GDP-tubulin (gray line) with either 1 mM GTP (black line) or 1 mM GDP and increasing BeF3- concentrations (1 mM, 2 mM, 4 mM, 6 mM, 8 mM and 10 mM; from light to dark blue). (B) Critical concentration (Cr) measurements of GDP-tubulin with 1 mM GTP (black square) or 1 mM, 2 mM, 3 mM, 4 mM, 5 mM, 6 mM, 7 mM and 8 mM BeF3- (blue circles). (C) Wyman plots showing the effect of increasing Mg2+ concentrations (4 mM, 5 mM, and 6 mM) on tubulin assembly (37°C) in the presence of 1 mM GTP (black squares) or 1 mM GDP plus 3 mM BeF3- (blue circles). Positive slopes indicate that at increasing Mg2+ concentrations the ion incorporation into the filament is higher, and similar slope values (under BeF3- and GTP) indicate a similar Mg2+ dependency of the polymerization. (D) Time course assembly of 30 μM GDP-tubulin with either 1 mM GTP (black line) or 1 mM GDP, 3 mM HKF2 and increasing concentrations of AlCl3 (0 μM, 50 μM, 100 μM, 250 μM, 500 μM and 1 mM; from light to dark red). (E) Time course assembly of 30 μM tubulin in the absence of free GTP (black line) and in the presence of increasing concentrations of BeF3- (100 nM, 500 nM, 1 μM, 10 μM and 50 μM; from light to dark blue) showing the stabilization effect of the analogue. (F) Time course assembly of 30 μM tubulin in the absence of free GTP and 0 mM HKF2 (black line) or in the absence of free GTP with 3 mM HKF2 and increasing concentrations of AlCl3 (0 μM, 50 μM, 100 μM, 250 μM, 500 μM and 1 mM from light to dark red). Aluminum contamination in nucleotides and glass induce MT stabilization even when no AlCl3 was added (light red). Arrows in graphs (A), (D), (E), and (F) indicate when samples were incubated at 4°C.


