. 2020 Mar 10;9:e50155. doi: 10.7554/eLife.50155

Figure 3. Fiber diffraction of MT models systems.

GDP-BeF3--MT (blue), GDP-AlFx-MT (red), GMPPCP-MT (salmon), GMPCP-MT (yellow), GMPCPP-MT (orange), GDP-Tx-MT (brown) and GDP-MT (gray). (A) Top; representative image (GMPCPP-MTs) of meridional diffraction displaying the meridional plane from l = 1 (4nm) layer line and related harmonics (l = 2 to 4) for longitudinal metric calculations. Bottom; meridional intensity patterns, where arrows indicate the 4 nm and 8 nm peaks. The inset shows the best fit of 1 nm band experimental intensities in a Lorentzian normal distribution, highlighting positional differences between all tested MT growing conditions (peaks maxima, arrows). (B) Top; representative image (GMPCPP-MTs) of equatorial diffraction highlighting the equatorial plane (l = 0) for lateral metric calculations. Bottom; equatorial intensity patterns showing the corresponding Bessel functions from J01 to J04+JN1. The inset shows the JN1, calculated as described in M and M, displaying the differences in peak maxima (arrows) that occur under various nucleotide polymerization conditions. The red dash line on (A) and (B) top images shows planes used for intensity line plotting in qx space and further metric calculations. (C) Estimation of the number of PFs per MT and percentage of each subpopulation within the solution from fiber diffraction experiments (left) and cryo-EM images (right).

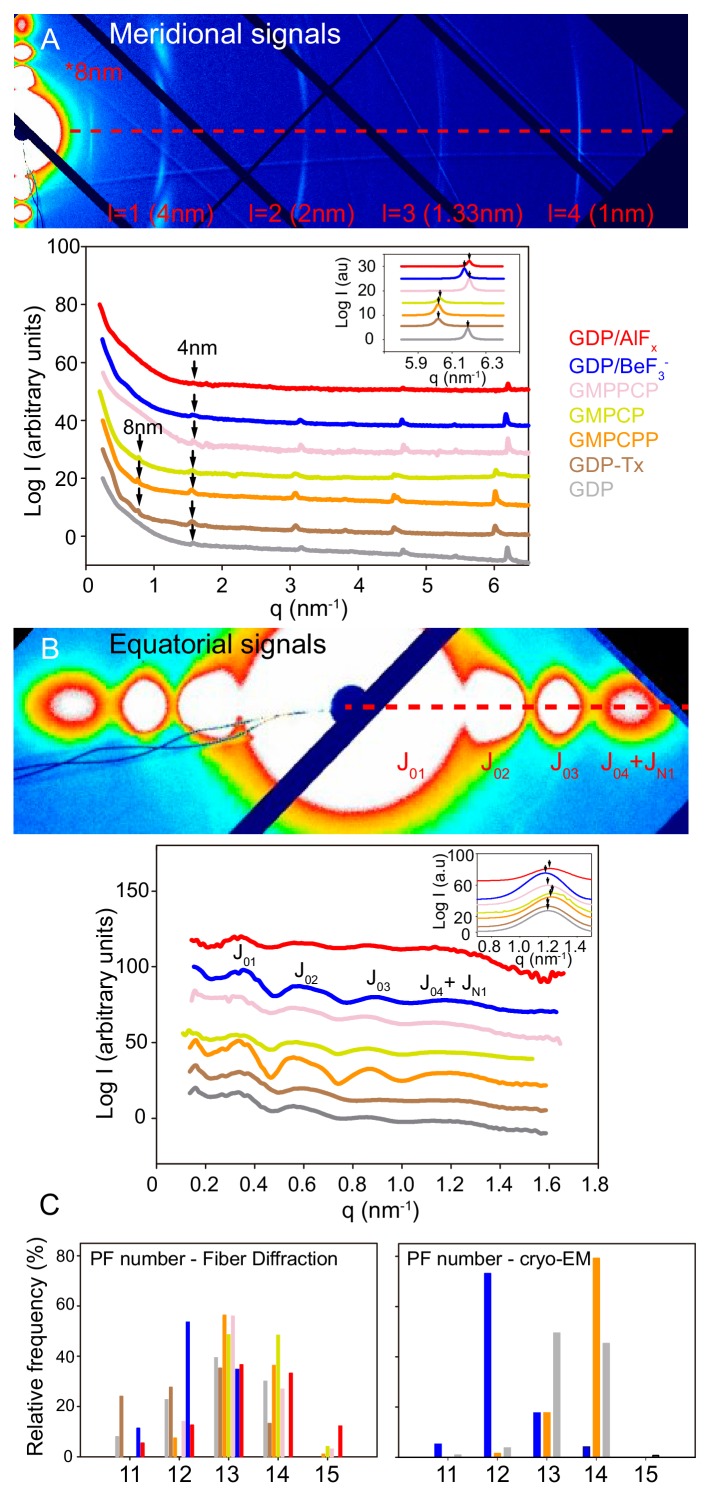
Figure 3.

Figure 3—figure supplement 1. Shear-flow aligned fiber diffraction experiments.

Figure 3—figure supplement 1.

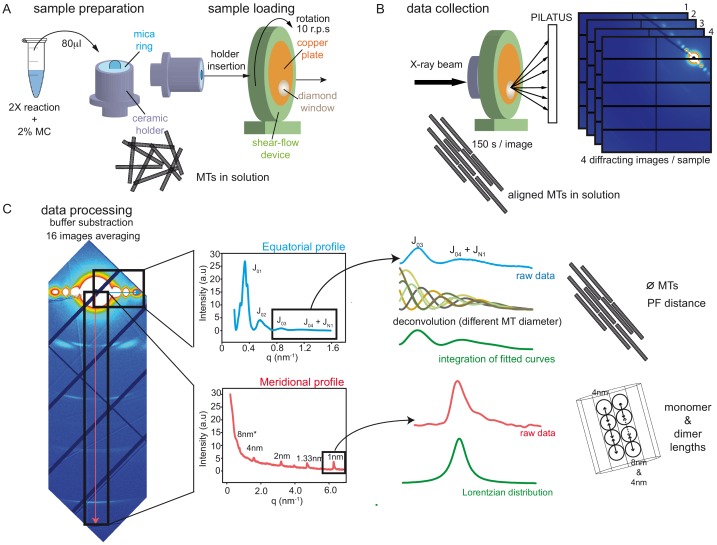
(A) 2X samples were incubated at 37°C and mixed (1:1) with pre-warmed 2% methylcellulose. The mixture was displayed onto a mica ring set on a ceramic holder and was inserted into the shear-flow device. Temperature and rotation was remotely controlled. (B) The sample was exposed to the X-ray beam and small angle diffracting images coming from the diamond window were collected in a 1M PILATUS detector. With an exposure time of 150 s, we could collect a maximum of 4 images per sample before any sign of radiation damage. (C) Images were buffer subtracted and averaged for data analysis. Each dataset (with a minimum of 16 images) was analyzed for the equatorial and meridional signals. The intensity profile was measured along distance from the center of the diffraction and subsequently analyzed. The equatorial profiles allowed the estimation of the diameter of the MTs, the PF number and the inter-PF distances. To get this information the J03 and J04+JN1 signals were deconvolved according to MTs with different putative PF numbers and the fitted curves were integrated and correlated with the raw data. The meridional profile shows peaks at the 8 nm and/or the 4 nm families of layer lines. We calculated the Lorentzian distribution of the 1 nm line (a Bessel harmonic of the 4 nm) to find differences in the axial spacing between α- and β-tubulin.
Figure 3—figure supplement 2. Shear-flow aligned fiber diffraction images.

Figure 3—figure supplement 2.

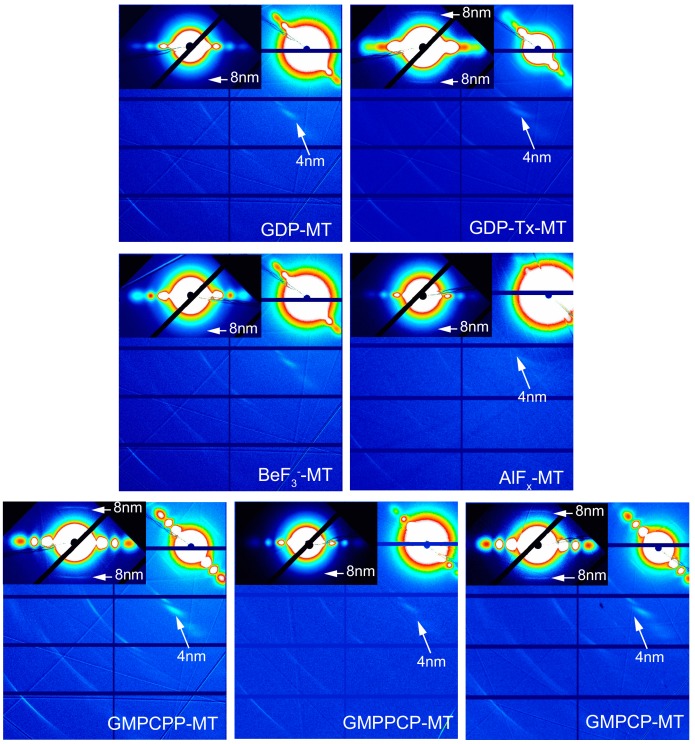
Dataset images from MTs assembled under different conditions, showing the meridional diffraction. Insets centered on the equatorial diffraction highlight the presence (GDP-Tx-, GMPCPP- and GMPCP-MTs) or absence (GDP-, BeF3--, AlFx- and GMPPCP-MTs) of the 8 nm layer line.
Figure 3—figure supplement 3. Shear-flow aligned fiber diffraction images of BeF3-- and AlFx-MTs in the presence of taxol.

Figure 3—figure supplement 3.

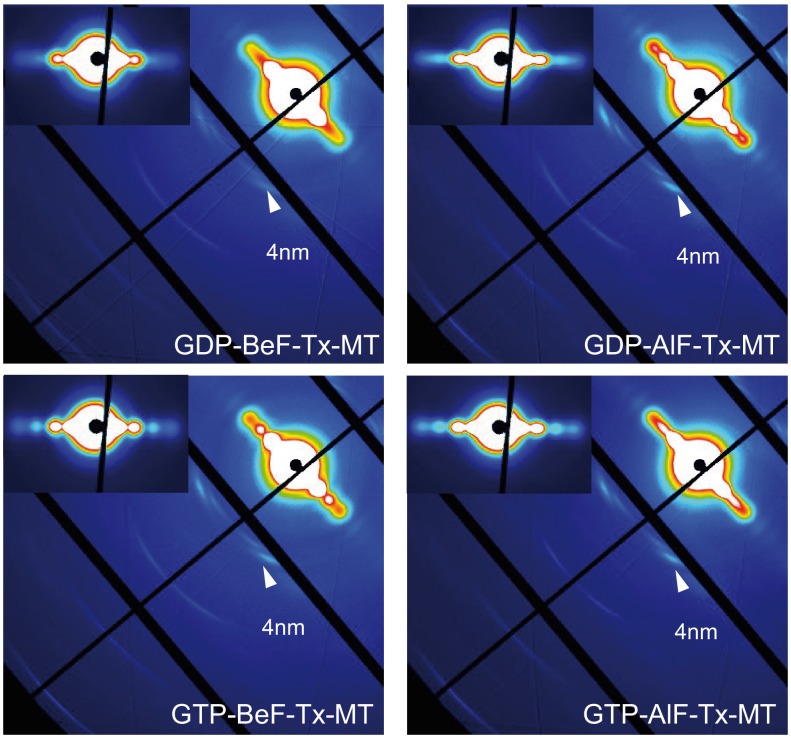
All these dataset images show the presence of the 4 nm layer lines and the clear absence (inset) of the 8 nm layer line.