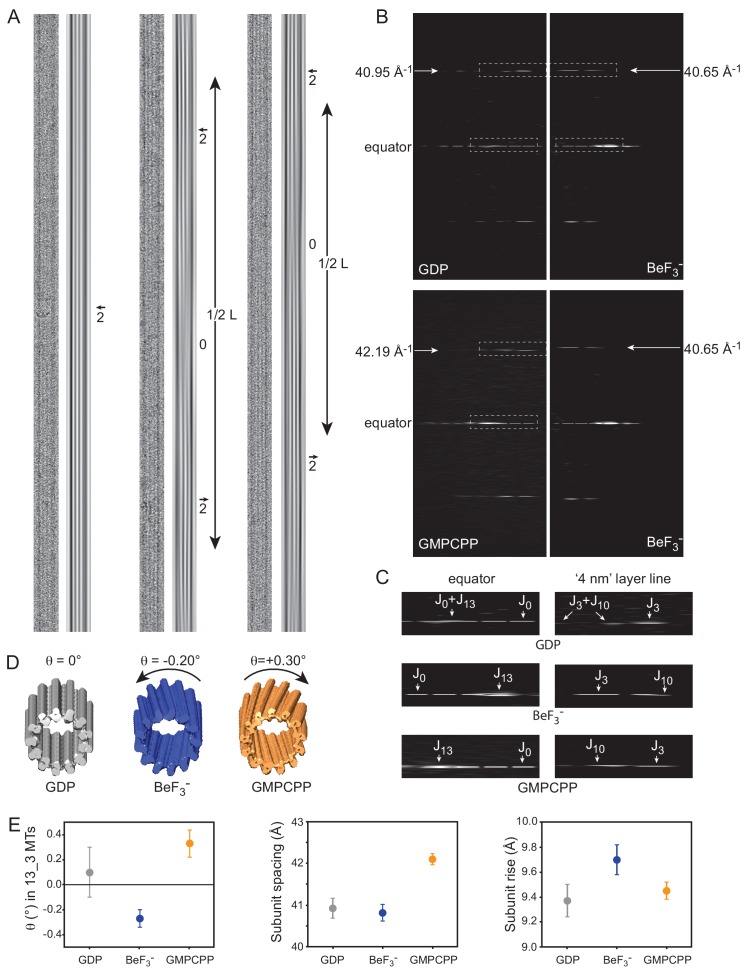
Figure 4. Cryo-EM of GDP-, BeF3--and GMPCPP-MTs.
(A) Straightened images of microtubules with 13 PFs (N) and 3-start monomer helices (S), denoted 13_3 (N_S) MTs. For each condition: raw image (left) and filtered image using the J0 and JN layer lines in the FFT of the MTs (right). Filtered images of 13_3 GDP-MTs display 2 dark inner fringes running parallel to the MT axis and slightly offset from it (arrow), which correspond to PFs from the top and bottom surfaces superposed in projection. In BeF3-- and GMPCPP-MTs, the 2 fringes make moiré patterns offset from the MT axis on one side and the other separated by blurred regions (noted ‘0’ for no internal fringes). The periodicity (L) of these moiré patterns provides a direct measure of their PF skew angle θ (Equation 8). (B) Comparison between the FFTs of the 13_3 GDP- vs. the 13_3 BeF3--MT (top), and the 13_3 GMPCPP- vs. the 13_3 BeF3--MT (bottom) in A. The monomer spacing along PFs (a in Equation 9) is given by the position of the J3 layer line in Fourier space, that is 40.95 Å, 40.65 Å, and 42.19 Å for the 13_3 GDP-, BeF3-- and GMPCPP-MTs in A, respectively. (C) Blow up of the equator and ‘4 nm layer lines’ in 13_3 GDP- (top), BeF3-- (middle) and GMPCPP-MTs (bottom), corresponding to the boxed regions in B. In 13_3 GDP-MTs, J0 and JN overlap on the equator, and J3 and J10 overlap on the ‘4 nm layer line’ since the PFs are parallel to the MT axis. In 13_3 BeF3-- and GMPCPP-MTs, J13 is away from the equator due to the PF skew. In BeF3--MTs, J10 is closer to the equator than J3, indicating that the PFs are left-handed (negative skew), while in GMPCPP-MTs, J10 is farther apart from the equator than J3, indicating that the PFs are right-handed (positive skew), (Chrétien et al., 1996). (D). 3D reconstructions of the 13_3 MTs in A using TubuleJ (Blestel et al., 2009). The 3D reconstructions were elongated to the same size as the original images and presented front face at a slight angle with respect to the MT longitudinal axis to emphasize the PF handedness in 13_3 GDP-MT (θ = 0°), BeF3--MT (θ = - 0.20°), and GMPCPP-MT (θ = + 0.30°). (E) Left: average PF skew angles of 13_3 GDP-MTs (θ = + 0.10 ± 20°, n = 15), BeF3--MTs (θ = - 0.27 ± 0.07°, n = 9), and GMPCPP-MTs (θ = + 0.33 ± 0.11°, n = 12). The average PF skew angle of 13_3 GDP_MTs must be lower since a majority of MTs did not show long enough moiré patterns that could be measured at the high magnification used. Therefore, their average PF skew angle is likely closer to 0°. Middle: average monomer spacing along PFs in GDP-MTs (a = 40.93 ± 0.24 Å, n = 66), BeF3--MTs (a = 40.82 ± 0.20 Å, n = 103), and GMPCPP-MTs (a = 42.10 ± 0.13 Å, n = 25). All N_S microtubule types were included in the analysis. Right: inter-PF monomer tubulin rise in GDP-MTs (r = 9.37 ± 0. 13 Å, n = 64), BeF3--MTs (r = 9.70 ± 0. 12 Å, n = 83), and GMPCPP-MTs (r = 9.45 ± 0. 07 Å, n = 24) determined using Equation 9. MTs with modified lateral interactions (essentially observed in 13_4 and 14_4 MTs in BeF3- conditions) were not included in this analysis (Chrétien and Fuller, 2000).


