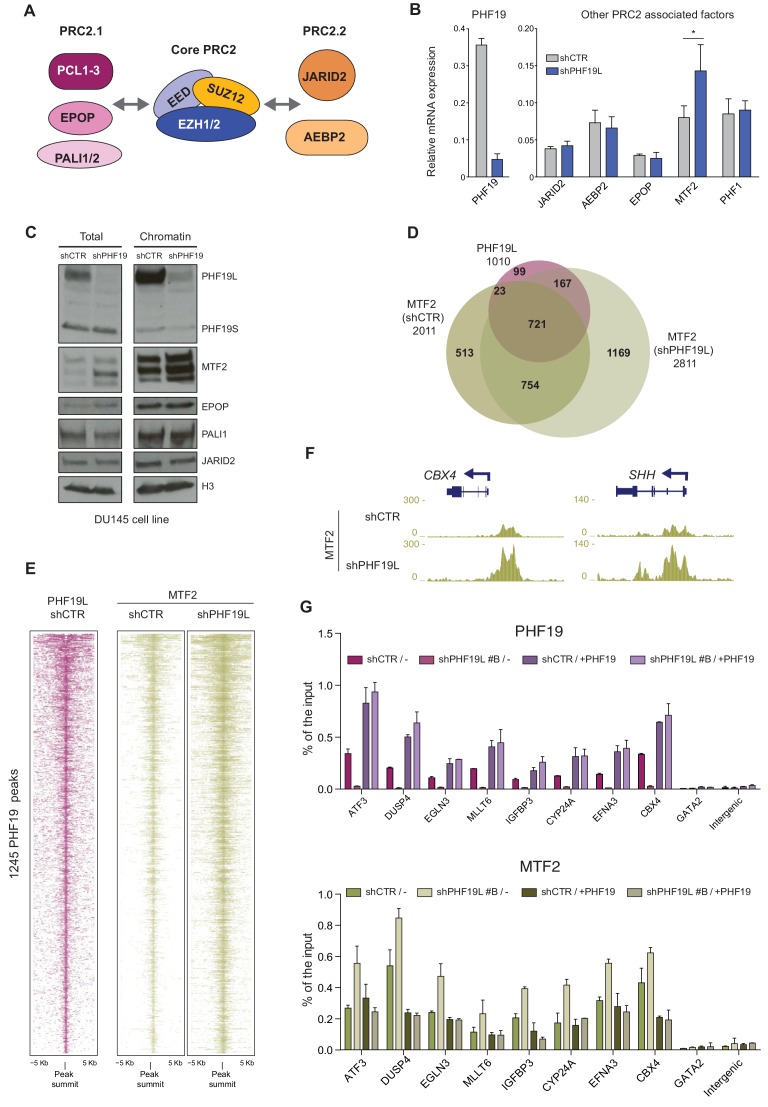
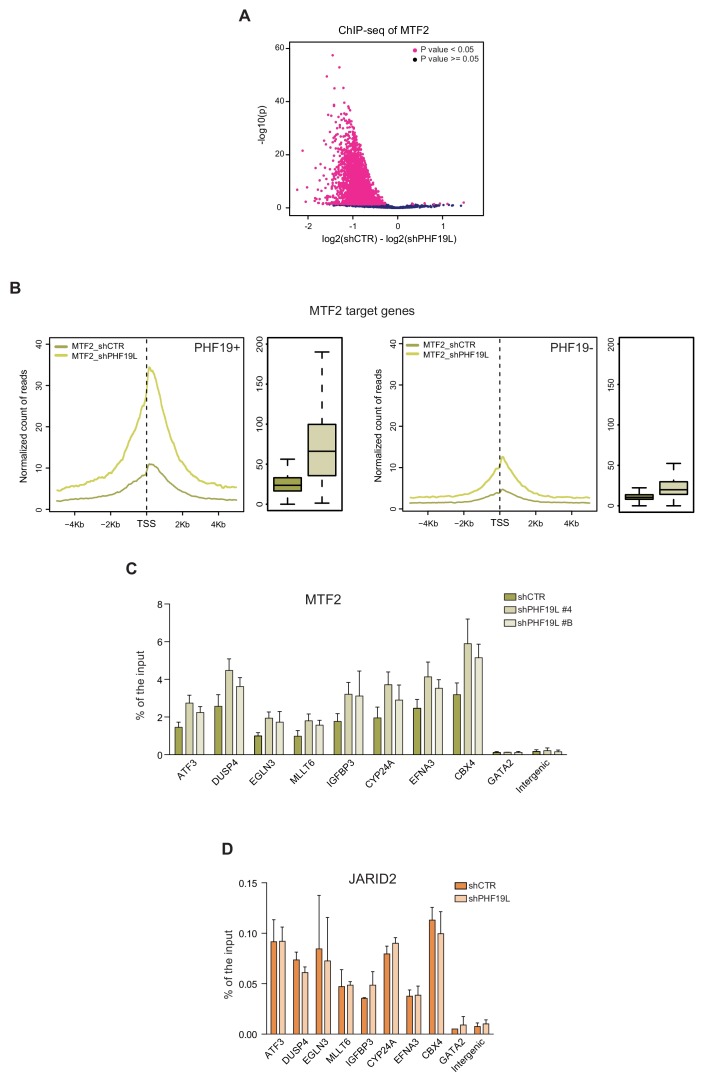
Figure 4. MTF2 is enriched in chromatin in the absence of PHF19L.
(A) Schematic representation of PRC2.1 and PRC2.2 complexes. (B) RT-qPCR of PRC2-associated factors in control and PHF19L-depleted (shPHF19L#4) DU145 cells. Expression was normalized to that of the housekeeping gene RPLPO. Data are presented as the mean ± SD of three biological replicates. Significance was analyzed through Student’s t-test. P value was < 0.05 (*). (C) Cell fractionation showing specific increase of MTF2 protein in whole cell extracts (total) and in the chromatin compartment after knockdown of PHF19L (shPHF19L#4) in DU145 cells. (D) Venn diagram showing overlapping of 1010 PHF19L targets with MTF2 target genes in control (shCTR) and PHF19L-depleted (shPHF19L#4) DU145 cells. (P value ≤ 10−16; Fisher’s exact test). (E) ChIP-seq heatmap of MTF2 on PHF19L peaks (peak summit ± 5 kb) in control and PHF19L-depleted (shPHF19L#4) DU145 cells. Enrichment levels are normalized for the total number of spike-in reads of each sample. Peaks are ranked by the intensity of PHF19 signal in the control condition. (F) UCSC genome browser screenshot showing two examples of genes (CBX4 and SHH) that gain MTF2 after PHF19L knockdown in DU145 cells. (G) Knockdown and rescue of PHF19: ChIP-qPCR experiments of PHF19L and MTF2 in DU145 cells control (shCTR) and PHF19L knockdown (shPHF19L#B, targeting the 3’ UTR region), transduced with either FLAG-tagged PHF19L (+PHF19) or FLAG-Empty vector (-). Amplification of the GATA2 and an intergenic region were used as a negative control. Data represent the mean ± SD from two biological replicates.


