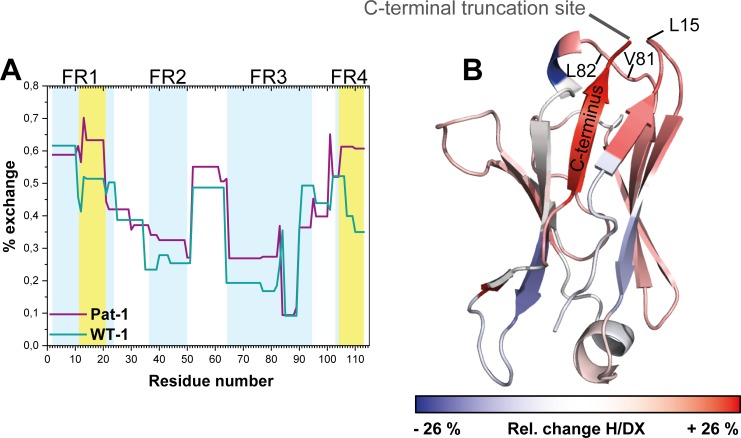
Figure 5. Comparison of hydrogen-deuterium exchange rates of Pat-1 and WT-1.
(A) The magnitude of exchange of Pat-1 is shown in purple, for WT-1 in cyan. FRs are highlighted in light blue, CDRs in white. Pat-1 shows overall higher exchange rate. Strongly affected regions are highlighted in yellow. The Experiment was performed twice. (B) The relative change in fractional uptake is mapped on the Pat-1 crystal structure. Negative and positive relative change values in H/DX indicate more dynamic WT-1 and Pat-1 regions, respectively. Relative change of H/DX of Pat-1 segments with respect to WT-1 is color coded from blue (low) to red (high). Source files for the H/DX measurement sets are available in Figure 5—source datas 1–4.

