. 2020 Mar 10;9:e51458. doi: 10.7554/eLife.51458

Figure 1. Landmark-dependent navigation task in virtual reality.

(A) Schematic of experimental setup: mice are head-fixed atop a cylindrical treadmill with two computer screens covering most of the animal’s field of view. A reward spout with attached lick-sensor delivers rewards. (B) Task design. Animals learned to locate hidden reward zones at a fixed distance from one of two salient visual cues acting as landmarks. The two landmarks were interleaved within a session, either randomly or in blocks of 5. After each trial animals were placed in a ‘black box’ (screens turn black) for at least 3 s. The randomized starting location ranged from 50 to 150 cm before the landmark. (C) Licking behavior of the same animal at novice and expert stage. Expert animals (bottom) lick close to the reward zones once they have learned the spatial relationship between the visual cue and reward location. (D) The Task Score was calculated as the difference in first lick location (averaged across trials) between short and long trials. (E) Relationship between trial start and first lick locations for one example session. Experimental design ensured that alternative strategies, such as using an internal odometer, could not be used to accurately find rewards. (F) RSC inactivation experiment. VGAT-Cre mice were injected with flexed Channelrhodopsin-2 (left). Stimulation light was delivered through skull-mounted ferrules on a random subset of trials (middle). During inactivation trials, task score was reduced significantly (right).

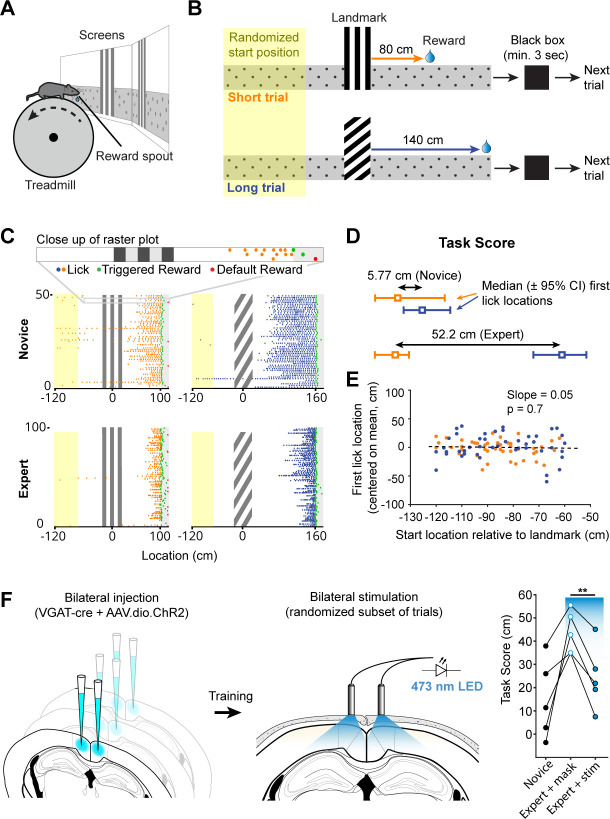
Figure 1.

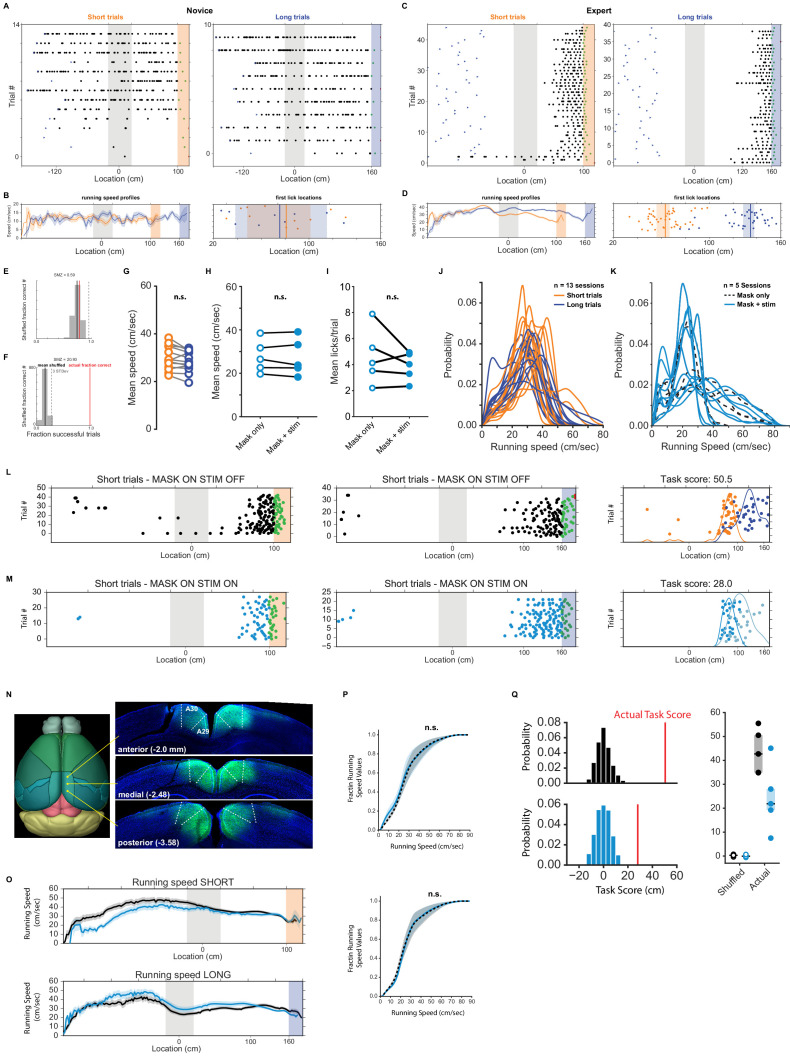
Figure 1—figure supplement 1. Running and licking behavior in naive animals and during optogenetic silencing.

Figure 1—figure supplement 1.

(A) Raster plot of licking behavior of example session of a novice animal with short and long trials separated. Note: during the recording the trials were interleaved. The blue triangles indicate the start location of each trial. (B) Left: Mean running speed as a function of space (5 cm bins, shaded is standard error of the mean). Right: Location of first licks on short and long trials superimposed. Shaded areas indicate 95% confidence interval. (C, D) Same as A and B but for an expert animal. (E) Spatial modulation z-score (SMZ) for novice animal (shown in (A)). The gray bars represent a histogram of fraction of successful trials when the location of licks was rotated randomly (repeated 1000 times). Dashed line: three standard deviations of that distribution. The red line indicated the animal’s actual fraction of successful trials within that session. (F) SMZ of an expert animal (shown in (B)). (G) Mean running speed on short and long trials for all recording sessions (Wilcoxon signed-rank test: p>0.05) (H) Same analysis as (D) but for running speed during mask only and mask + stimulation trials during optogenetic inactivation sessions. (I) Mean number of licks in mask only vs mask + stim conditions. Overall number of licks was not influenced by stimulation light. (J) Kernel density estimates of running speeds for all recording sessions for short and long trials. (K) Same analysis as (J) but during mask only and mask + stim conditions. (L) Licking behavior in a session where on 50% of trials only the masking light was shown, and the other 50% the masking and optogenetic stimulation light was shown. On short trials (left column) and long trials (center column) when only the masking light was shown. Right column: the first lick per trial on short (orange) and long (blue) trials plotted. (M) Same as (L), but when mask and optogenetic stimulation light was on. (N) ChR2 expression in RSC. A mouse was injected using the same protocol as during the inactivation experiment. (O) Running speed profiles during stimulation and mask-only trials showing small but overall not significant differences between those two conditions. (P) Normalized cumulative distribution of speed values (K-S test: pshort_trials = 1.0, plong_trials = 1.0). (Q) Label-shuffle test of mask-only and stimulation trials. To test whether mice confuse, mis-assign or can’t see/identify landmarks and their respective reward locations we randomly re-assigned the labels of each trial type (short vs. long) and re-calculated the task score. This process was repeated 1000 times and the resulting mean task score compared to the recorded one. We found a significant difference between the shuffled and actual task scores (One-way ANOVA p<0.0001, tukey post-hoc test) suggesting that animals are worse at locating the reward zone based.