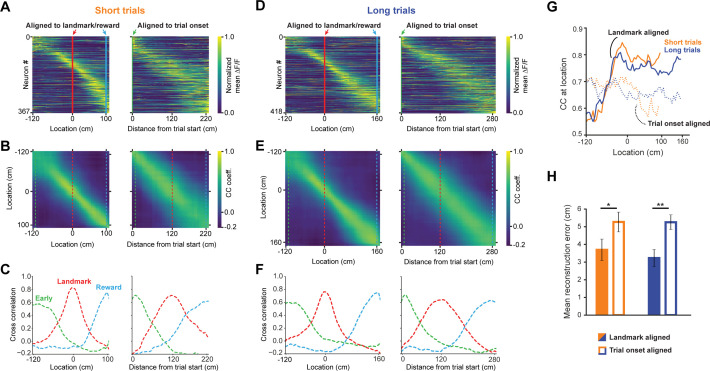
Figure 3. A landmark-anchored code for space in RSC.
(A) Activity of all task engaged neurons ordered by location of peak activity on short trials. Left columns: neurons aligned to the landmark/reward; right columns: same neurons aligned to trial onset point. (B) Population vector cross-correlation matrices of data shown in (A). (C) Slices of the cross-correlation matrices early on the track (green dashed line), at the landmark (red dashed line), and at the reward point (blue dashed line), show sharpening of the spatial code at the landmark. (D–F) Same as (A–C) but for long trials. (G) Population vector cross-correlation values at the animal’s actual location. Solid lines: activity aligned to landmark/reward; dashed lines: activity aligned to trial onset. (H) Reconstruction error, calculated as the mean distance between the maximum correlation value in the cross-correlation matrices and the animal’s actual location, is significantly lower when neural activity is aligned to landmarks (solid bars) compared to trial onset aligned (open bars; Mann-Whitney U: short trials: p<0.05, long trials: p<0.001).


