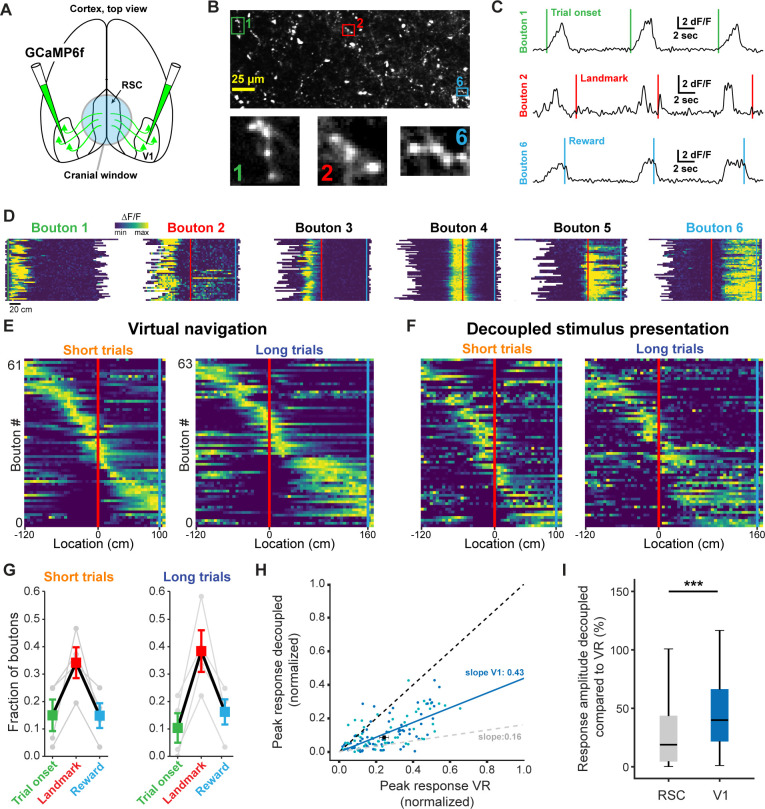
Figure 7. V1 axonal bouton responses in RSC.
(A) Overview of injection and recording site. (B) Example FOV and three example boutons shown in (C) and (D). Where possible, ROIs were drawn around clusters of boutons belonging to the same axon. (C) Trial onset, landmark, and reward aligned boutons from same animal. (D) Six example boutons showing tuning to pre- and post-landmark portions of the track. (E) Population of V1 boutons in RSC ordered by location of their response peak (n = 61 boutons short track/63 boutons long track, four mice). (F) Same boutons as in (E) during decoupled stimulus presentation. (G) Alignment of boutons to task features. (H) Response amplitude during virtual navigation of decoupled stimulus presentation with fitted regression line. In gray: fitted regression line for RSC neurons. (I) Comparison of response amplitude differences between VR and decoupled stimulus presentation in RSC neurons and V1 boutons (meanRSC = 0.42 ± 0.03, meanV1 = 0.53 ± 0.04, Mann-Whitney U test: p<0.001).


