. 2020 Feb 27;9:e52560. doi: 10.7554/eLife.52560

Figure 1. Sequence analysis of the J protein superfamily in eukaryotes and euglenozoans.

(A) Similarity network of DnaJ and Pam16 domain-containing proteins clustered by CLANS with a P-value threshold value of 1 × 10⁻¹². A cohesive Pam18 cluster is recovered (blue), as well as a more diffused Pam16 cluster (red). Two smaller and cohesive Kinetoplastea-specific clusters corresponding to Pam27 (green) and Tb927.4.650 (orange) are also recovered. (B) Condensed phylogenetic tree inferred by IQ-TREE and the best-fitting LG+R5 model from the Pam16, Pam18, Pam27 and Tb927.4.650 clusters identified in the protein similarity network (see Figure 1—figure supplement 2 for a fully annotated phylogenetic tree). Thick branches represent branch support values higher than 70% SH-aLRT and 70% UFBoot2+NNI. Only representative protein sequences corresponding to Saccharomyces cerevisiae S288C and Trypanosoma brucei brucei TREU927 are labeled. The phylogenetic tree recovers clades that correspond to the clusters identified by the protein similarity network. Phylogenetic tree is arbitrarily rooted in the internal branch between the Pam27 and all other clades. - For species name, phylogenetic affiliation and database source for each of the predicted proteomes used in the similarity network and phylogenetic analyses see Figure 1—source data 1.

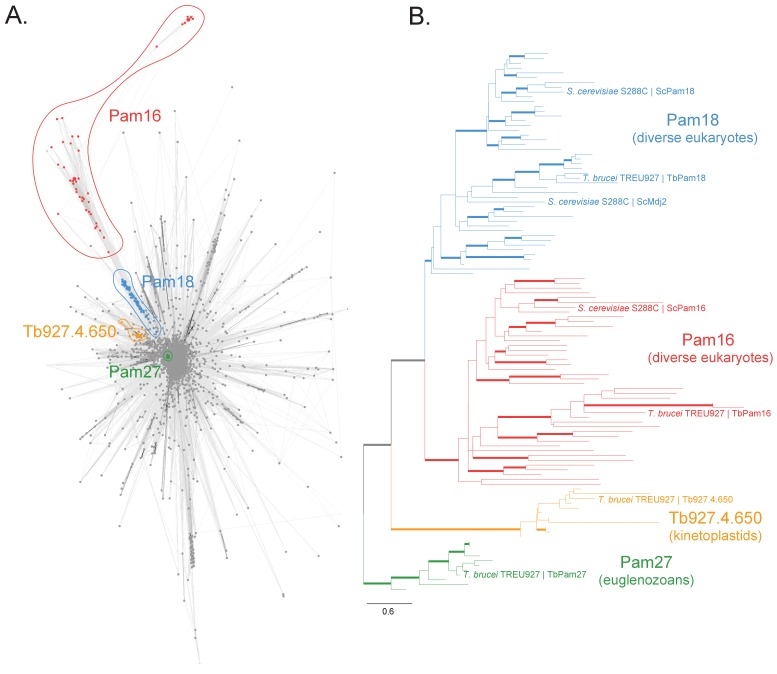
Figure 1—source data 1. Species name, phylogenetic affiliation and database source for each of the predicted proteomes used in the similarity network and phylogenetic analyses.

Figure 1.

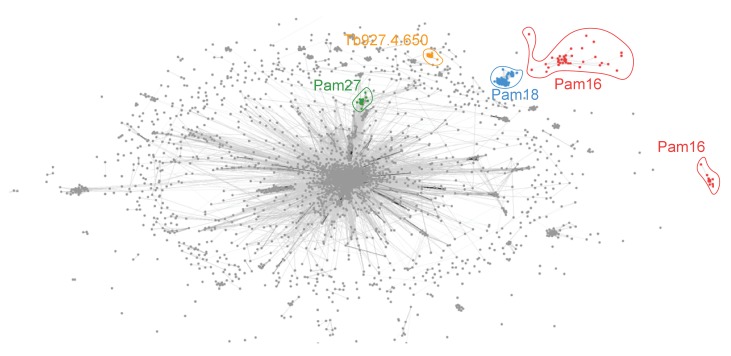
Figure 1—figure supplement 1. Similarity network of the J protein superfamiliy clustered with a P-value threshold of 1 × 10⁻²⁰.

Figure 1—figure supplement 1.

Similarity network of DnaJ and Pam16 domain-containing proteins clustered by CLANS with a P-value threshold value of 1 × 10⁻²⁰. By lowering the P-value threshold the central tight cluster disassembles to some degree and reveals some of its substructure. The Pam18 (blue), TbPam27 (green) and Tb927.4.650 (orange) clusters remain cohesive. The Pam16 (red) family is now found as two distinct clusters representing most eukaryotes and kinetoplastids.
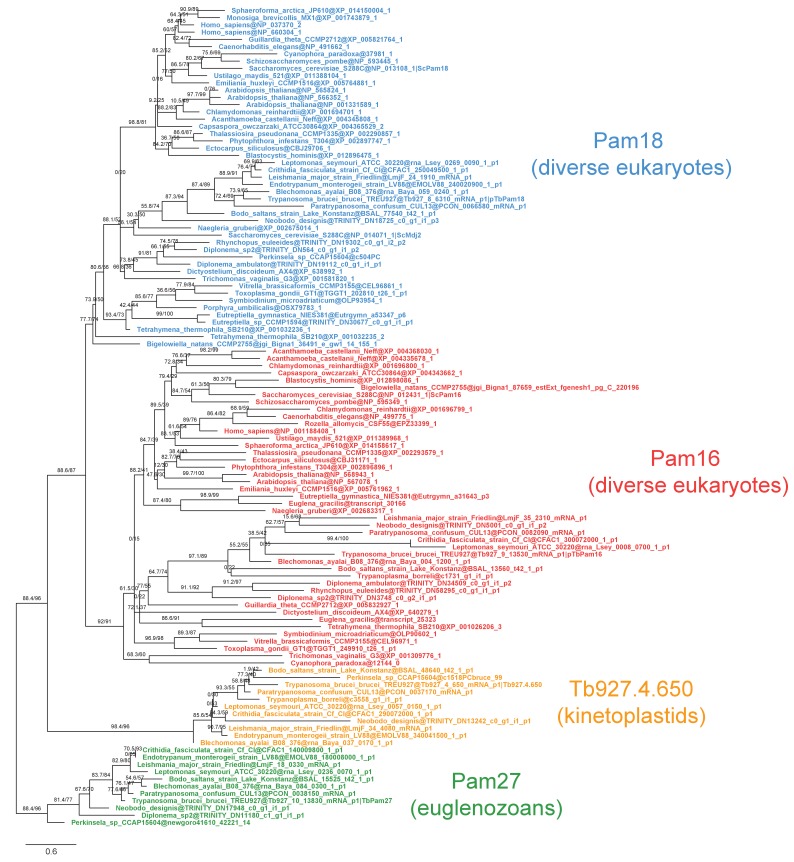
Figure 1—figure supplement 2. Fully annotated phylogenetic tree of Pam16, Pam18, TbPam27 and Tb927.4.650 J protein subfamilies.

Figure 1—figure supplement 2.

Phylogenetic tree inferred by IQ-TREE and the best-fitting LG+R5 model from the Pam16, Pam18, TbPam27 and Tb927.4.650 clusters identified in the protein similarity network. Thick branches represent branch support values higher than 70% SH-aLRT and 70% UFBoot2+NNI. Only representative protein sequences corresponding to Saccharomyces cerevisiae S288C and Trypanosoma brucei brucei TREU927 are labeled. The phylogenetic tree recovers clades that correspond to the clusters identified by the protein similarity network. Phylogenetic tree is arbitrarily rooted in the internal branch between TbPam27 and all other clades.