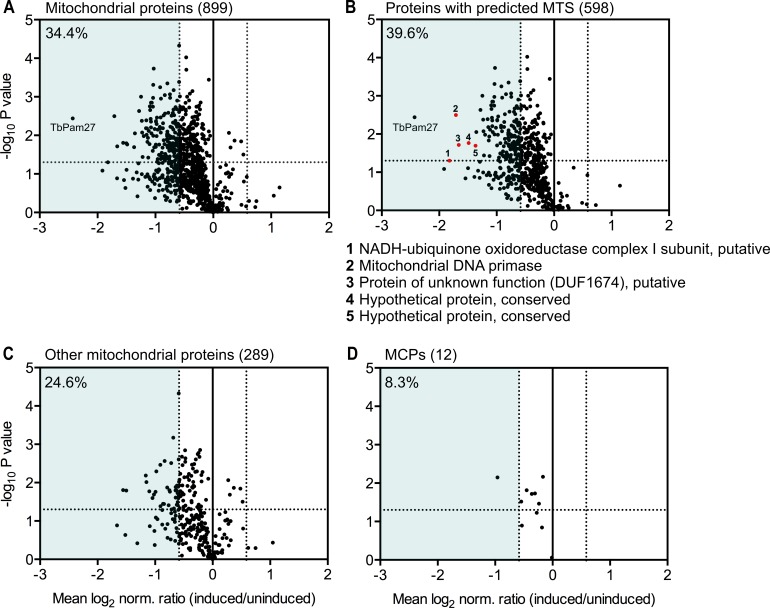
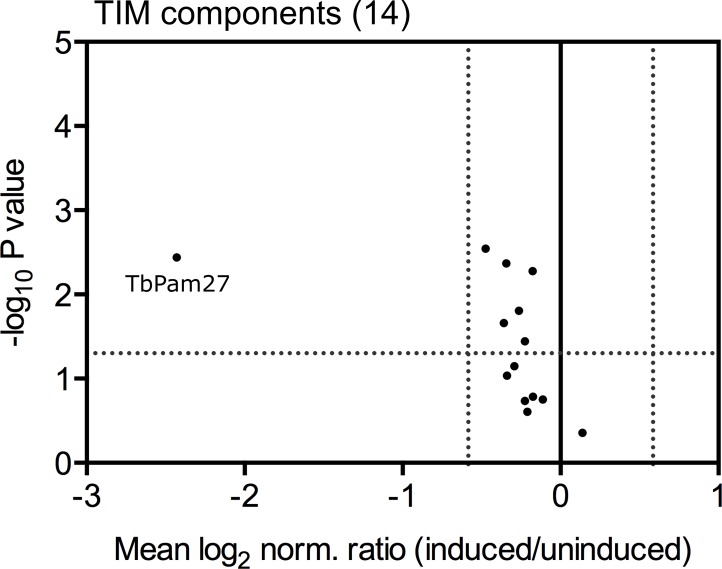
Figure 9. Global mitochondrial proteome changes upon ablation of TbPam27.
Digitonin-extracted mitochondria-enriched fractions of uninduced and 1.5 days induced TbPam27 RNAi cells were subjected to SILAC-based quantitative MS. The mean log2 of normalized ratios (induced/uninduced) was plotted against the corresponding -log10 P value (two sided t-test). (A) Volcano plot depicts all mitochondrial proteins identified in this experiment (Peikert et al., 2017). (B) Volcano plot shows proteins with a predicted mitochondrial targeting sequence (MTS) (Almagro Armenteros et al., 2019). Numbered red dots and the respective protein names below the figure, correspond to the five most downregulated, significantly detected proteins besides TbPam27. (C) Volcano blot depicts the remaining other mitochondrial proteins, which were detected in this experiment, besides mitochondrial carrier proteins (MCPs), which are shown in (D). Numbers in parentheses specify how many proteins were detected in each subset. The horizontal dotted line indicates a t-test significance level of 0.05. The vertical dotted lines mark a fold-change in protein abundance of ±1.5 in each plot. The blue background indicates a downregulation of 1.5-fold. The percentage of proteins that are downregulated more than 1.5-fold in each sub-dataset is indicated in the upper left corner of each panel. For a list of all proteins identified in the SILAC-MS experiment see Figure 9—source data 1.


