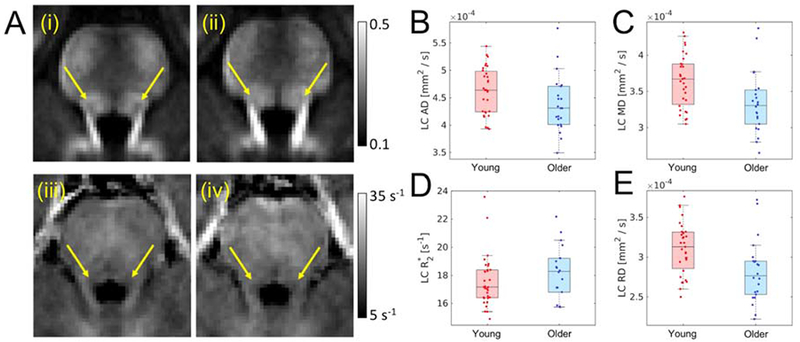
Figure 3.

Part A shows comparison of mean LC FA in young (i) and older adult (ii) cohorts as well as mean R2* in young (iii) and older adult (iv) cohorts. In A (i-iv) arrows show the approximate location of LC. Group comparisons are shown for AD (B), MD (C), and RD (D), and R2* (E). A statistically significant increase in mean LC FA was observed in the older cohort while reductions in mean LC RD and mean LC MD were seen in the older cohort. LC – locus coeruleus; MD – mean diffusivity; AD – axial diffusivity; RD – radial diffusivity; FA – fractional anisotropy.
