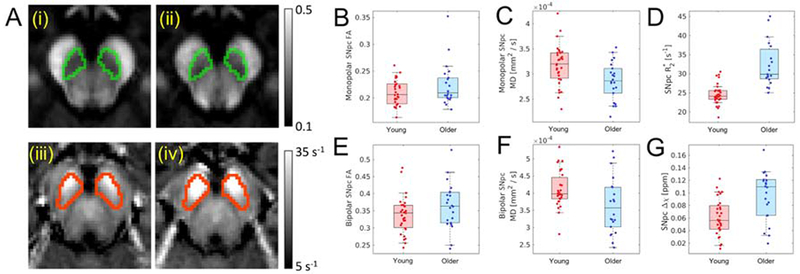
Figure 5.

Part A shows comparison of mean SNpc FA in young (i) and older adult (ii) cohorts as well as mean R2* in young (iii) and older adult (iv) cohorts. SNpc is outlined in green in mean FA maps (i and ii) and red in mean R2* maps (iii and iv). Group comparisons are shown for monopolar FA (B) and bipolar FA (E), monopolar MD (C) and bipolar MD (F), R2* (D), and susceptibility (G). Statistically significant increases in mean SNpc R2* and susceptibility were observed in the older adult cohort while a reduction in mean SNpc MD were seen in the older adult cohort for monopolar and bipolar DTI acquisitions. SNpc – substantia nigra pars compacta; MD – mean diffusivity; AD – axial diffusivity; RD – radial diffusivity; FA – fractional anisotropy.
