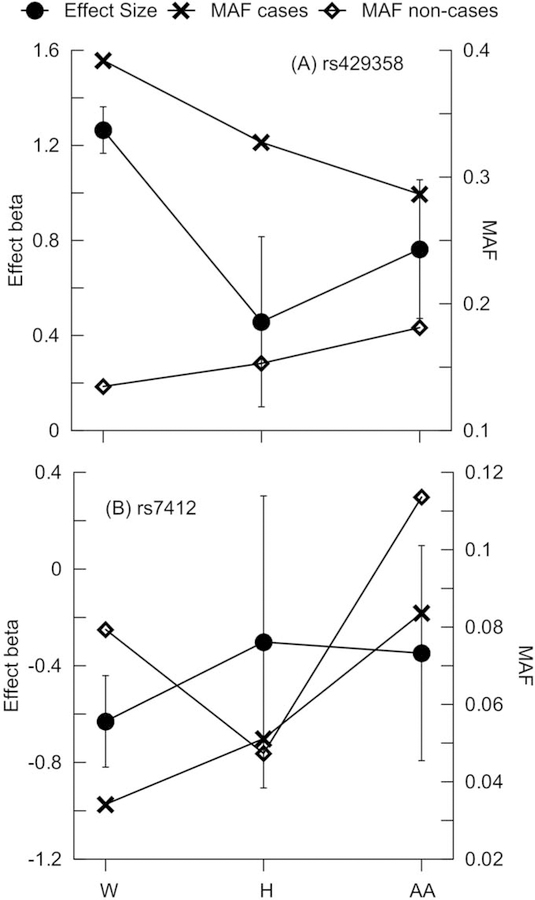
Figure 1. Minor allele frequencies (MAF) and the estimates of genetic effects.
MAF (right y-axis) and statistics for the effects (left y-axis) are given for (A) rs429358 coding the APOE ε4 allele and (B) rs7412 coding the APOE ε2 allele for Whites (W), Hispanics (H), and African Americans (AA), separately. MAF is given for AD-affected (cases, crosses) and unaffected (non-cases, diamonds) subjects. Bars show 95% confidence intervals.

