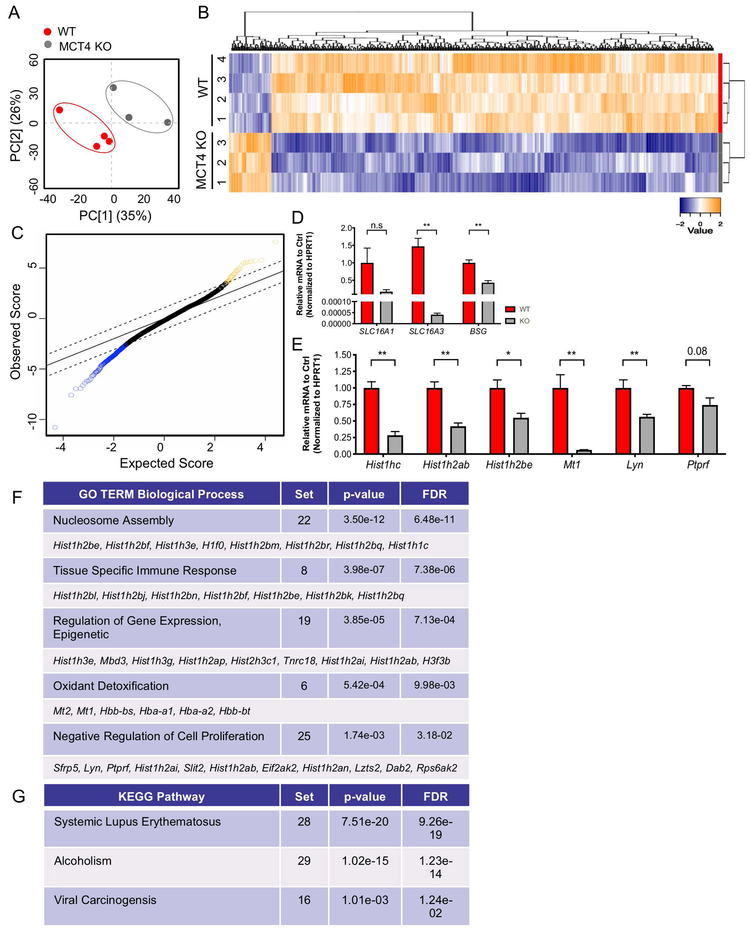
Figure 4: Loss of MCT4 Leads to Diminished Transcriptional Program.
A) Principal component analysis (PCA) of transcriptomic profiles from the NP compartment of 14 mo WT and MCT4 KO animals used in Clariom S Mouse Microarray. B). Heatmap and hierarchical clustering of SST-RMA normalized values of u350 differentially expressed protein-coding genes (DEGs) in WT and MCT4 KO samples with FDR ≤ 5%. C) The top 50% most expressed genes were used for Significance Analysis of Microarrays (SAM). SAM was run at 5,000 permutations and the False Discovery Rate was set at 5%. D) qRT-PCR analysis of SLC16A1, SLC16A3, and BSG mRNA expression in MCT4 KO mice. E) qRT-PCR analysis confirming decreased expression of DEGs identified from SAM plot. F, G) DAVID was used to compute enriched pathways in the genes that are upregulated. Gene ontology (GO) terms for biological process (BP) and KEGG pathways were examined. Top u10 DEGs involved in each process are shown. The number of DEGs from the multivariate analysis involved in each biological process shown as “Set”.

