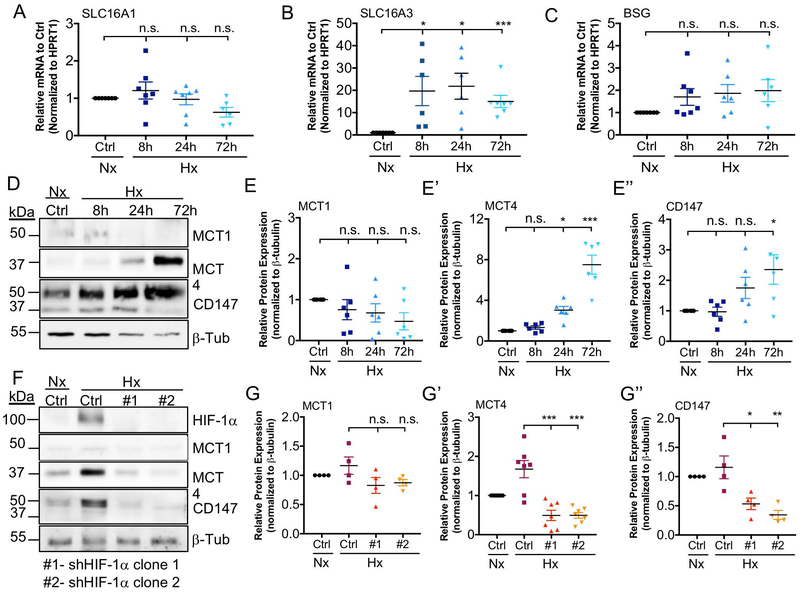
Figure 8: MCT4 Expression is Hypoxia-inducible and HIF-dependent.
A-C) qRT-PCR analysis of SLC16A1 (A), SLC16A3 (B), and BSG (C) mRNA expression in rat NP cells cultured under hypoxia (1% O2) for up to 72 h. D) Representative Western blot analysis of MCT1, MCT4, and CD147 protein expression in rat NP cells cultured under hypoxia for up to 72 h. E-E’’) Densitometric analysis of MCT1 (E), MCT4 (E’), and CD147 (E’’) from Western blot experiment shown in (D). F) Representative Western blot analysis of HIF-1α, MCT1, MCT4, and CD147 protein expression in rat NP cells after silencing HIF-1α with two independent shRNAs. G-G’’) Densitometric analysis of Western blot showed in (F) above. (n=4 independent experiments). Statistical analysis: One-way ANOVA. n.s.= not significant; *, p-value ≤ 0.05; **, p-value ≤ 0.01; ***, p-value ≤ 0.001.

