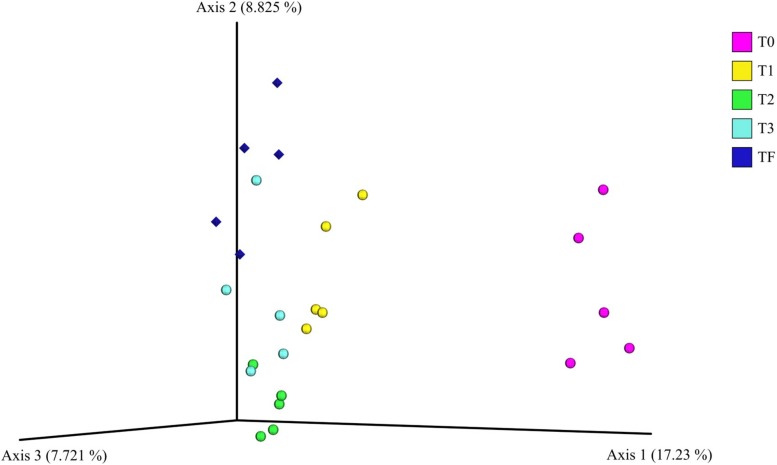
FIGURE 7.
Principal coordinate analysis plot of the bacterial communities in the A. nordmanniana rhizosphere. The analysis included 2-year-old plants from field (TF), and 2-year-old plants included in the transplant experiment of greenhouse plants to the field: T0 = before transplanting, T1 = 3 months after transplanting, T2 = 6 months after transplanting, and T3 = 9 months after transplanting. Analysis is based on the unweighted-UNIFRAC distances. Diamonds are field samples of 2-year-old non-transplanted plants, and circles are greenhouse samples before and after transplanting to field nursery.

