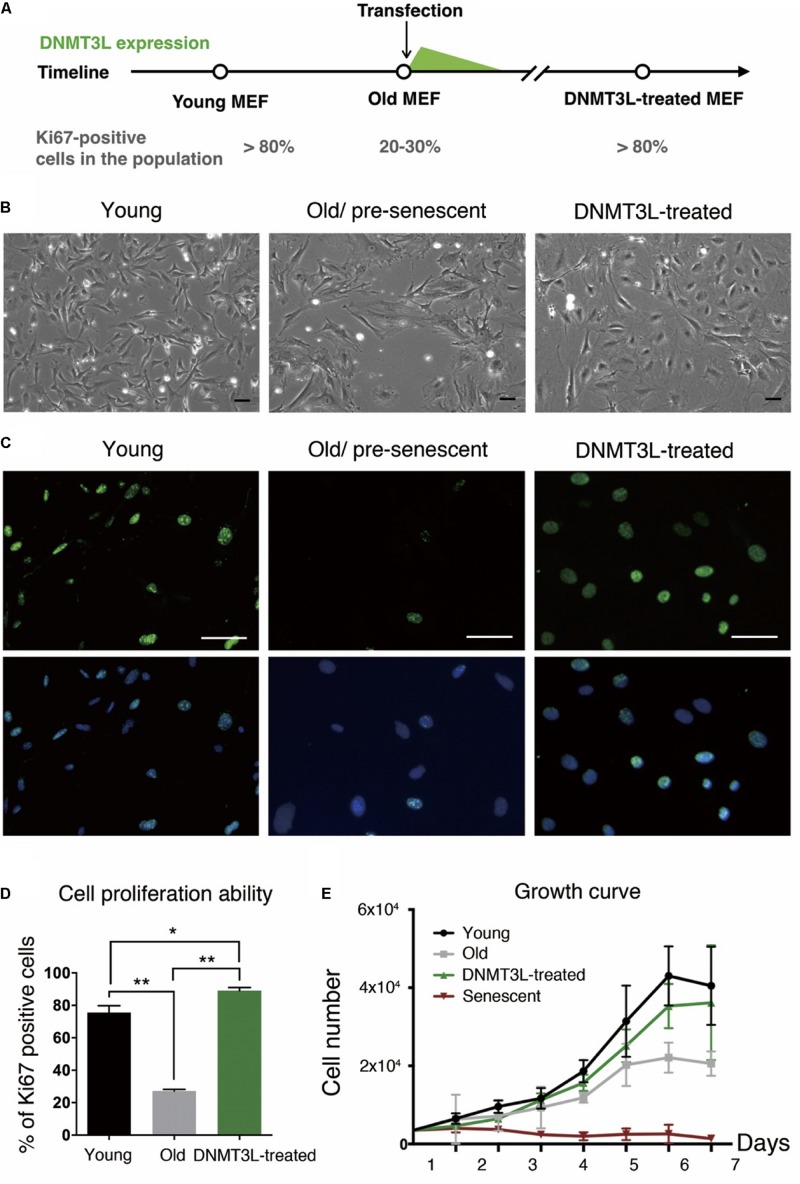
FIGURE 1.
Ectopic DNMT3L pulse restored the proliferation ability of aging MEFs. (A) Timeline of the sampling time points and the ectopic DNMT3L expression timing. The percentage of Ki67-positive cells in the population indicated the stage of cells. (B) Representative bright-field microscopy images of young, old/presenescent and DNMT3L-treated MEFs as labeled. Scale bar = 10 μm. (C) Representative Ki67-immunofluorescence images of the indicated cells. Green: Ki67 (proliferating cells); blue: Hoechst 33342 (nuclei). Bar = 10 μm. (D) Frequency distribution of proliferating cells among the three cell types based on the percentage of Ki67–positive nuclei. Mean ± SEM, n = 3. Asterisks indicate averages with significantly differences at *p < 0.05 or **p < 0.01, as determined by Student’s t-test. (E) Growth curve of the labeled cell populations. The black lines indicate the young MEFs; the gray lines indicate the old/presenescent MEFs; the green lines indicate the DNMT3L-treated MEFs; and the dark-red lines indicate the senescent MEFs. The cells were initially seeded at 5000 per well in a 24-well tissue culture plate (mean ± SEM, n = 6).

