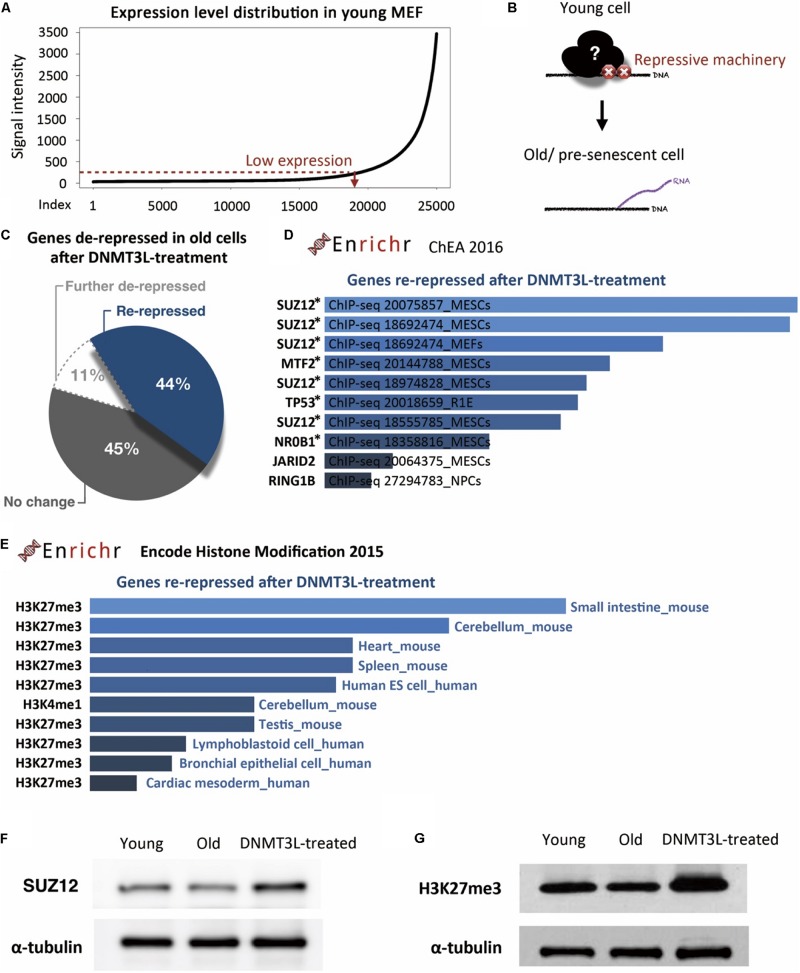
FIGURE 4.
DNMT3L treatment enhanced the repression of derepressed PRC2-targeted genes in old MEFs and globally reinforced H3K27me3 markers. (A) The distribution of gene expression in young MEFs was determined by a microarray analysis. According to the curve, we manually defined a threshold for the probe signal intensity below 100 as indicating a gene with low expression. The following analysis focused on these low-expression genes that lose repression in old MEFs. (B) Illustration of the genes with aging-associated loss of repression and their original repressor in young MEFs. (C) Pie chart indicating the change in genes derepressed in old MEFs after DNMT3L treatment. (D) The top 10 potential consensus transcriptional regulators of genes derepressed in old MEFs and re-repressed after a DNMT3L pulse are listed. The gene set described above was submitted to Enrichr and aligned with the ChEA 2016 database. All the listed regulators, SUZ12, MTF2, TP53, NR0B1, JARID2, and RING1, have significant hits with p < 0.05. The asterisks indicate the genes with p-values < 0.05. (E) Most-consensus histone modification of the genes described above in other cell lineages according to Encode Histone Modification 2015 (Enrichr). The listed markers in each dataset have a significance of p < 0.05. (F,G) Western blot analysis of extracts from young, old/presenescent and DNMT3L-treated MEFs with anti-SUZ12 and anti-H3K27me3 antibodies. The quantity of α-tubulin represents the loading control of similar cell numbers.

