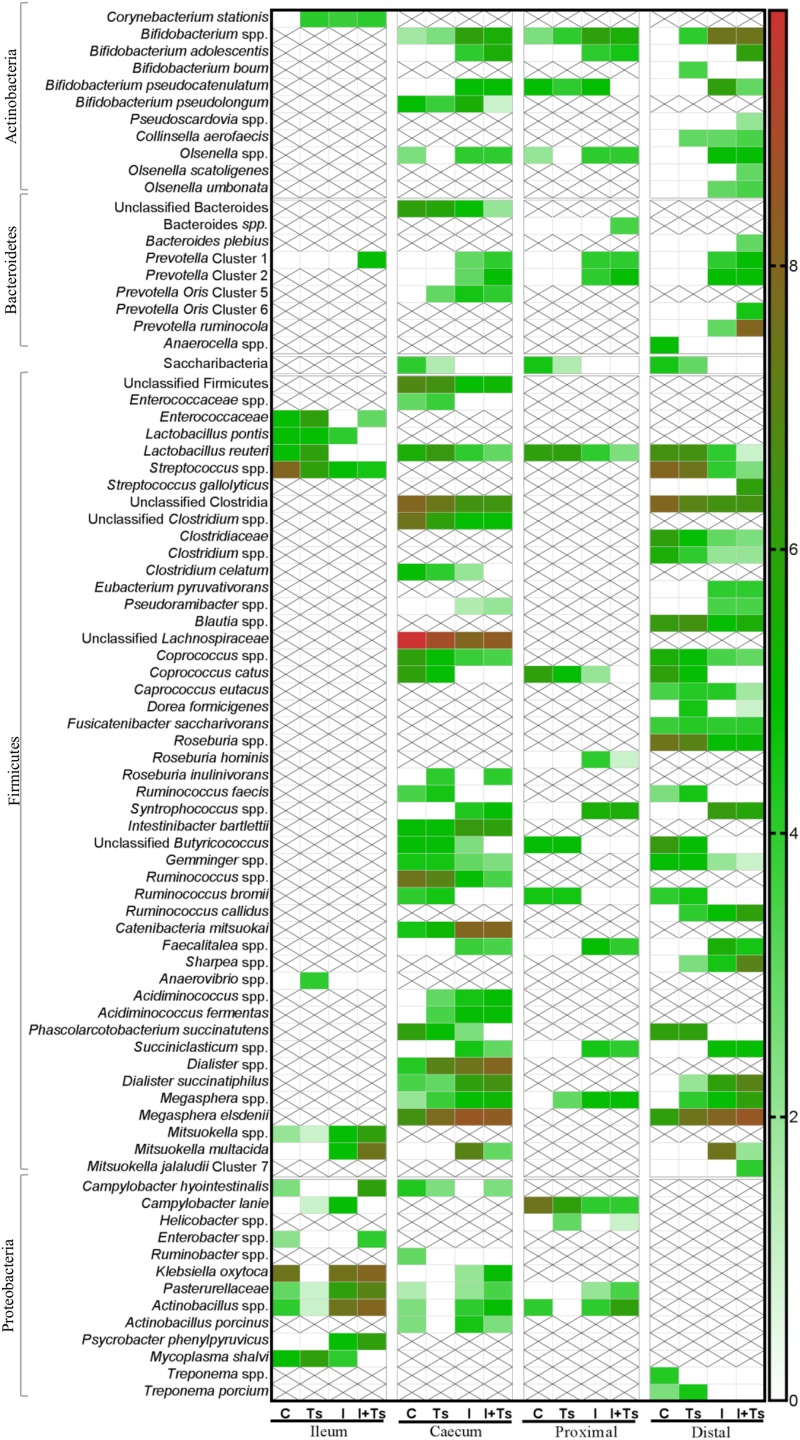
FIGURE 7.
The experimental treatment affected specific taxa more than intestinal segment. Heatmap of significantly different log abundance of luminal taxa at day 28 post-infection (p.i.). Only taxa found to be significantly different by ANCOM (p < 0.05) between two or more groups are included. X denotes no difference in abundance in the segment, not non-presence (C, control; Ts, Trichuris suis; I, inulin; I + Ts, inulin + T. suis).

