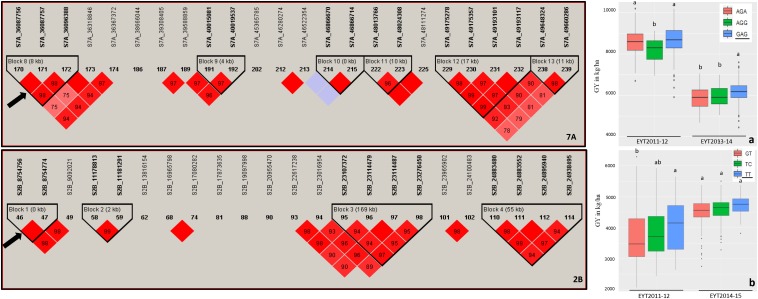
FIGURE 1.
Partial haplotype maps of chromosomes 7A and 2B showing haplotype blocks HB19.8 and HB5.1 (indicated with an arrow) associated with GY in B-5IR and B-2IR environments, respectively (left part of figure). The numbers inside the diamonds are the r2 values between SNPs on a scale of 0 to 100%. Allelic effects of the haplotypes in blocks HB19.8 (a) and HB5.1 (b) on grain yield (Y axis in kg/ha) are shown on the right. The favorable haplotypes are underscored based on the highest mean.

