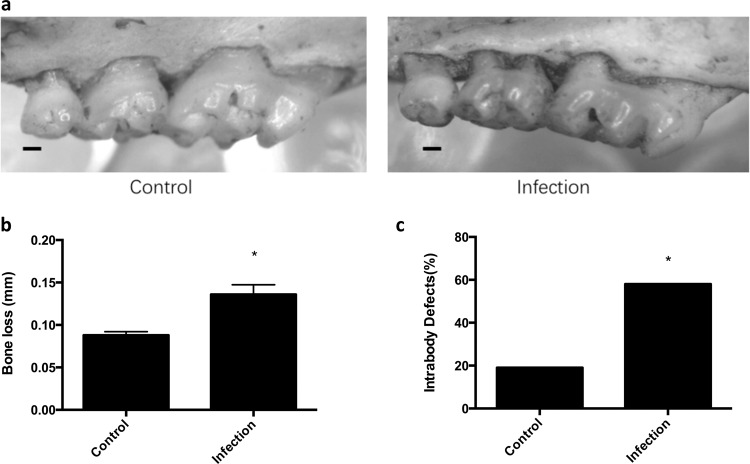
Fig. 4. Alveolar bone loss is significantly increased with the polymicrobial infection.
a Representative images of alveolar bone loss on the palatal surfaces of maxillary molars in control and infection groups. Scale bar represents 0.2 mm. b The graphs represent alveolar bone loss in control mice or mice with the polymicrobial infection (Infection). Data represent the means ± s.d. from six mice per group. For each mouse, alveolar bone loss was calculated as the average from 28 sites (3 sites on the first molar, 2 sites on the second molar, and 2 sites on the third molar, on both sides of the left maxilla and mandible). *, the difference in alveolar bone loss was significant (p < 0.001) compared to the Control group. c The percentage of intrabony defects was calculated as the number of tooth surfaces containing periodontal intrabony defects out of total tooth surfaces. For each group, there were a total of 72 tooth surfaces (6 mice, 36 molars, 72 sides (buccal, palatal/lingual)). *, the difference in the percentage of intrabony defect was significant (p < 0.001) compared to the Control group.

