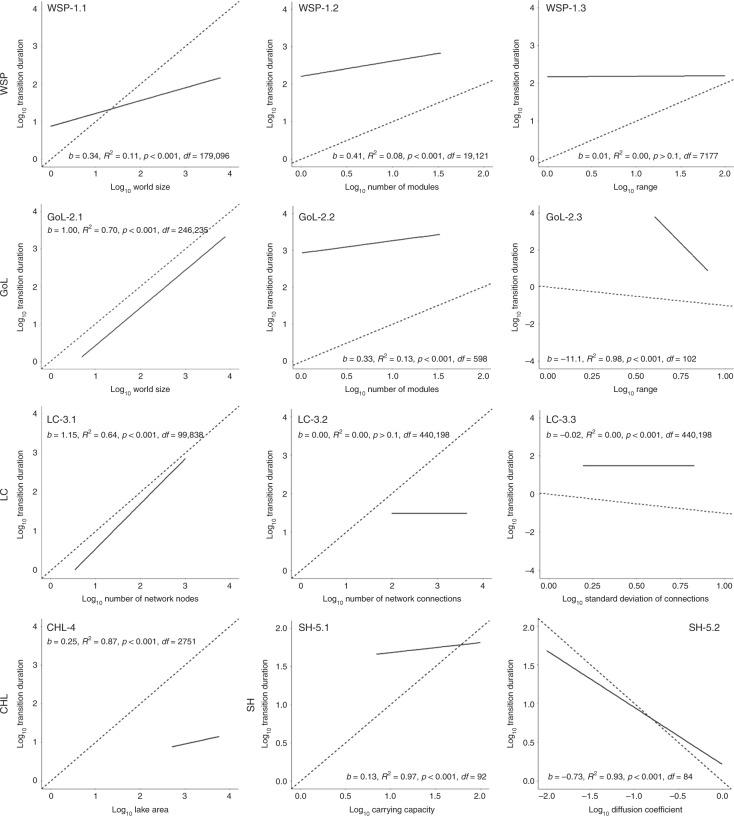
Fig. 3. Modelled outputs exploring the relationships between regime shift duration and twelve spatial characteristics.
The trend lines and regression coefficients resulting from the twelve simulation experiments (#1.1–#5.2) show the effects of different spatial properties on the duration of system shift (Table 1). Dashed lines are 1:1 reference lines plotted with a y-intercept of ‘0’. Log–log axes are used for consistency with Fig. 1, with the ‘b-term’ representing the slope of the regression model. See Supplementary Table 8 for the linear model coefficients and comparisons.

