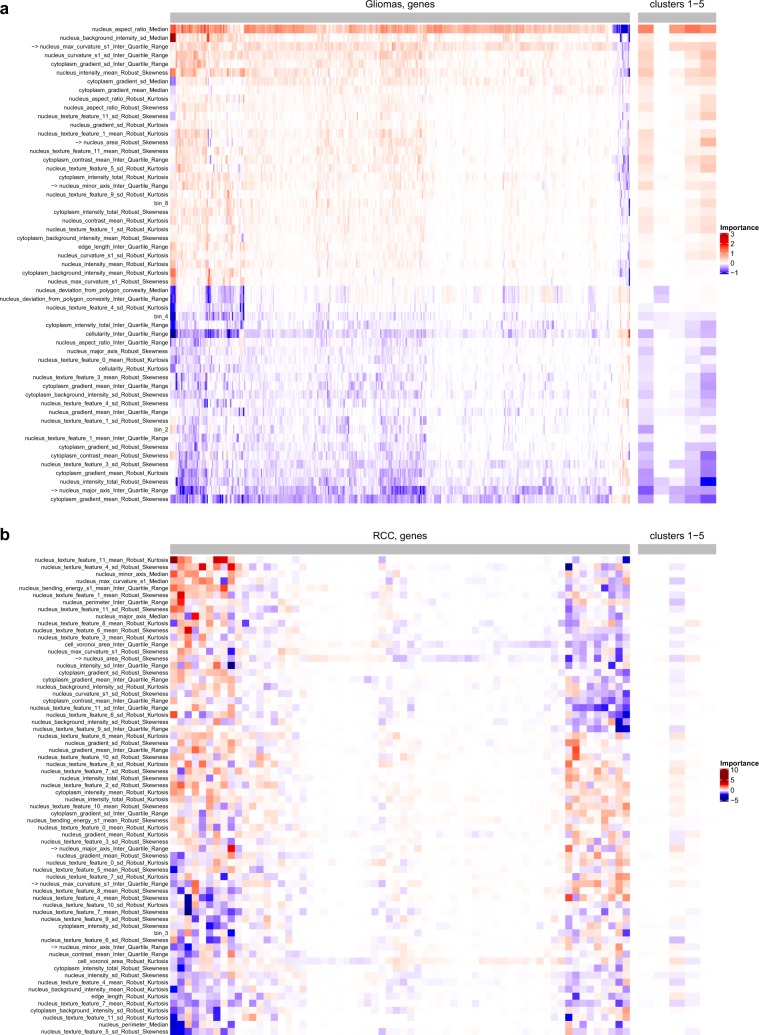
Fig. 7. Feature importance analysis in the glioma and RCC samples.
The top 25% most influential features in the logistical regression models are shown for the glioma samples (a) and RCC samples (b). For each cancer datasets, the well-predicted genes (the left side of the heat map) and the gene clusters (the right side of the heat map) are included in the analysis. Four of the most important features that are found in both the glioma and RCC samples are labeled with an asterisk.

