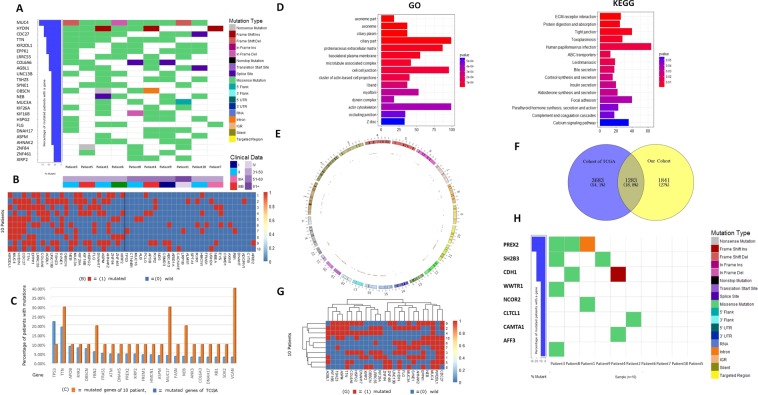
Figure 2.
(A) Heat maps of somatic cell mutation, stage and age information in 10 patients with HCC; (B) left: Highly frequent mutant genes in 10 patients (25 in total). Right: Highly frequent mutant genes in TCGA database (28 in total). Heat maps were generated for the 53 gene mutations in 10 patients. The frequency of TCGA mutations was not high in our 10 patients. (C) Comparison of high frequency gene mutations between 10 HCC patients in our center and TCGA database. (D) GO and KEGG pathways involved in 10 HCC patients in our center. (E) Circos of mutation information in 10 HCC patients. (F) Venn diagram for comparison of mutant genes and TCGA mutant genes in 10 HCC patients. (G) Clustering heat map of high frequency mutant genes in 10 HCC patients. (H) Heat map of driver gene mutation in 10 HCC patients.

